Corn kernel dry down outlook for October and November in Michigan
 Print
Print Email
EmailAccurate kernel dry down estimation can facilitate timely corn harvest.
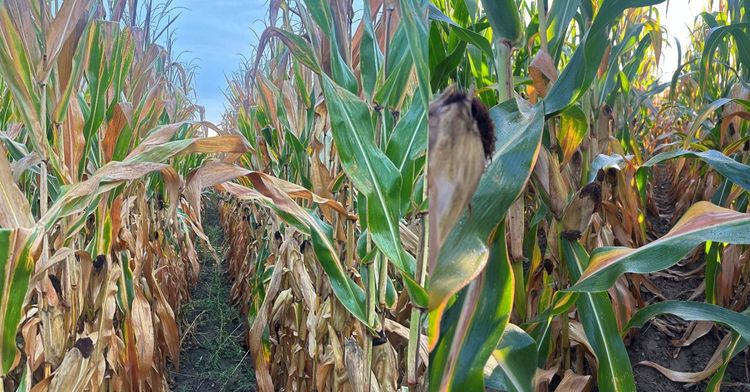
According to the USDA-NASS weekly crop progress report, only 23% of Michigan’s corn had reached physiological maturity by the last week of September, roughly half the level reported at the same time last year and the 5-year average. At maturity, corn kernels could have moisture content up to 35% based on planting date and hybrid relative maturity. In the coming weeks, more corn will reach physiological maturity, meaning that much of the state’s corn will dry down in October and November.
In previous Michigan State University Extension articles, the MSU cropping system agronomy team provided estimates covering the dry down period from early September to mid-November for several hybrid maturities and planting dates. Those estimates remain valid, and we encourage growers whose corn matured earlier to refer to them for dry down rates. However, given the statewide delay in corn maturation, the goal of this article is to provide growers with estimated weekly dry down rates from October through mid-November. These weekly estimates can help growers better anticipate changes in kernel moisture and make more informed decisions about harvest.
What dry down rates to expect?
Dry down rates were estimated using data from field trials conducted in Lansing, MI with multiple hybrid relative maturities (89-109 RM) and planting dates (late April to early June) across four growing seasons (2021-2024). Overall, kernel dry down rates will change significantly from the first week of October through mid-November. The highest dry down rate (averaged across multiple hybrid maturities and planting dates) is expected to be 0.58% per day during the first week of October (Table 1). In the second week of October, dry down rate could decline by approximately 38%, to 0.36% per day. Dry down rates are expected to continue declining during the third and fourth weeks of October, although the rate of decline will likely be smaller than the steep decline observed between the first and second weeks.
In the first week of November, dry down rates are expected to average 0.18% per day, approximately 28% lower than the rate during the final week of October. By the second week of November, dry down rates could decline further, averaging as low as 0.13% per day (Table 1).
It is important to emphasize that the dry down rates presented here are averaged across multiple hybrid relative maturities, planting dates, and growing seasons. As highlighted in our previous articles, dry down rates can vary depending on these factors. Therefore, growers may need to make small adjustments to these dry down estimates to reflect their specific hybrid maturity, planting date, and growing conditions. For example, early and mid-maturity hybrids planted early will mature earlier and could dry down at a higher rate than late maturity hybrids.
Table 1. Kernel dry down rates estimated for each week of October and the first two weeks of November. Dry down rates were obtained using data from field trials conducted in Lansing, MI with multiple hybrid relative maturities and planting dates across four seasons (2021-2024).
|
Month |
Week |
Daily dry down rate (%) |
|---|---|---|
|
October |
1 |
0.58 |
|
October |
2 |
0.36 |
|
October |
3 |
0.31 |
|
October |
4 |
0.25 |
|
November |
1 |
0.18 |
|
November |
2 |
0.13 |
How is kernel moisture changing during the dry down period?
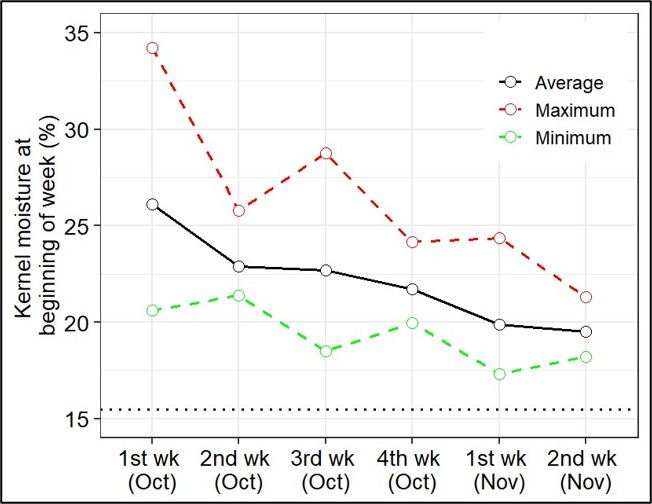
Figure 1 shows grain moisture content from the first week of October through the second week of November. The black solid line represents the average grain moisture content, while the red and green dashed lines indicate the maximum and minimum moisture observed during each period, respectively. Although the black line shows a relatively linear decline in average moisture, the red and green lines illustrate greater variability in grain moisture over time. In our data, this variability reflects differences in hybrid maturity, planting date, and growing seasons.
Overall, during the first week of October, kernel moisture averaged 26%, but ranged from 21% to 34%, reflecting differences in the timing of physiological maturity. In the second week of October, grain moisture averaged 23%, with values ranging from 21% to 26%. This relatively sharp decline was associated with the higher dry down rates observed during this period. During the third and final weeks of October, grain moisture averaged 22% (range: 18.5–28%) and 21% (range: 19–24%), respectively. By November, grain moisture averaged 19%, with values ranging from 17% to 24%.
We encourage growers to regularly monitor kernel moisture to gain a clear understanding of the moisture status of their corn fields and make informed harvest decisions. Using moisture meters remains a reliable approach for determining grain moisture but can be time consuming as it requires harvesting of ears and kernel threshing. Growers interested in faster technologies can consider using handheld sensors. We have evaluated a handheld sensor that provided accurate grain moisture measurements and offers a practical option for in-field grain moisture monitoring. However, upfront and annual costs need to be factored in for such sensors.
Impact of weather during the dry down period
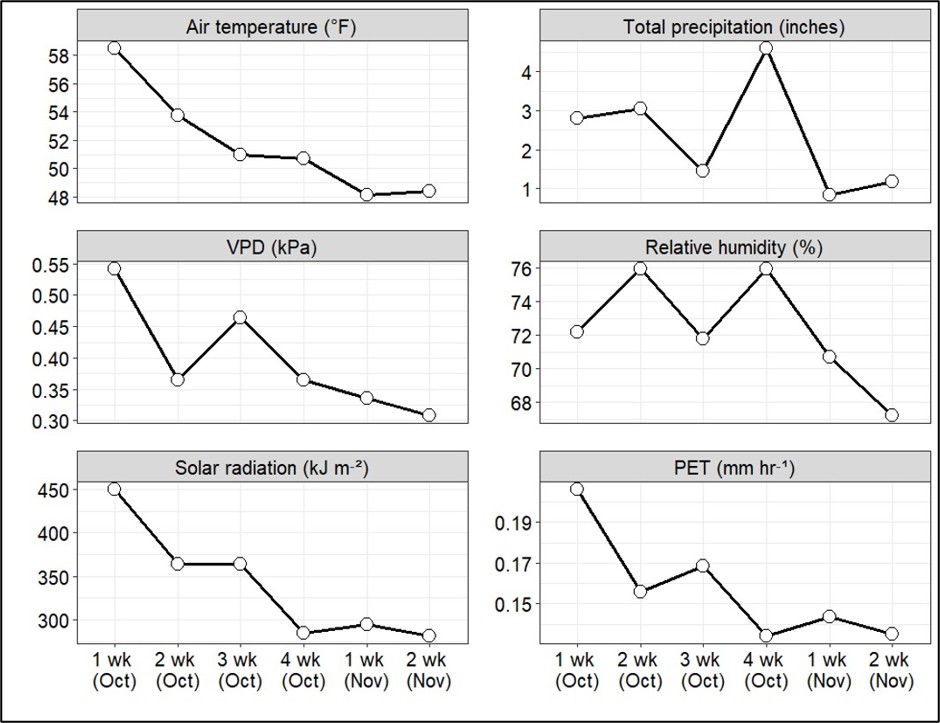
Weather conditions strongly influence kernel dry down. Variables such as air temperature, solar radiation, vapor pressure deficit (VPD), and potential evapotranspiration (PET) have been shown to positively influence dry down rates, whereas relative humidity and rainfall have a negative relationship with dry down. From the first week of October, air temperature, VPD, solar radiation, and PET are expected to continue declining (Figure 2). The decline in these weather variables will contribute to the reduction in kernel dry down rates. Rainfall and relative humidity, however, do not follow a consistent seasonal pattern; some years’ experience relatively wet Octobers which increase humidity, while others are considerably drier and less humid. The current 6-10 days, 8-14 days, and 3 weeks weather forecasts for October points to less than normal chances of rainfall. If these dry conditions hold, our data shows that kernel dry down rates in the first, second, and third week of October could range from 0.40-0.70% per day as we observed in some seasons where October was very dry.
It is important to note that no single weather variable controls kernel dry down. Therefore, dry down can still occur on cloudy days with limited solar radiation, provided that air temperatures remain sufficiently high. This observation is particularly important in October and November, when favorable conditions across all key weather variables are less likely to occur simultaneously.
We are currently working on developing a dry down calculator similar to what is currently available in Iowa. When ready, this tool will allow growers to estimate dry down rates based on factors such as planting date, hybrid maturity group, and weather conditions.
Key takeaways
- Most Michigan corn fields will dry down in October and November.
- Kernel dry down rate will average 0.58% in the first week of October and decline to about 0.13% by the second week of November.
- However, if October stays dryer than normal as the current forecast shows, dry down rates in the first three weeks could increase up to 0.70% per day.
- Grain moisture content will decline from October through November, although moisture levels may vary within the field.
- Air temperature, solar radiation, VPD, and PET will decline steadily during the dry down period and will reduce dry down rate.
- Monitor kernel moisture regularly for optimal harvest timing.