Electrical energy generation and the future
Do you know where your power comes from, or what it costs?
We use electrical energy every day to turn on the lights, take a shower, cook dinner and charge our cell phones. Have you ever thought about where the energy to do these things came from or how it got to your light bulb, cooking stove or wall outlet? In this article, Michigan State University Extension will explore current sources and costs of electrical energy.
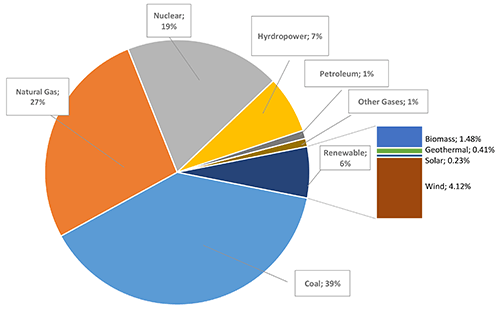
According to the U.S. Energy Information Administration, in 2013 the United States produced 4,058 billion kilowatt-hours of electrical energy. Fossil fuels contributed a total of 67 percent with coal being the single largest source of electrical energy at 39 percent. Renewable energies only accounted for 6 percent of the total electrical generation, with wind in the lead at 4.12 percent.
2013 U.S. electricity generation by source

As we look forward to the future, we need to evaluate the financial and environmental cost of each technology and fuel source. An ideal world would consist of low cost energy derived from renewable resources with the least impact on the environment and climate. While fossil energy sources tend to produce more greenhouse gases and pollution in the environment, cleaner and renewable energy sources are more costly. This is a tradeoff that we will have to carefully evaluate and decide what is best for us as a country.
A study published in April 2014 by the U.S. Energy Information Administration titled “Levelized Cost and Levelized Avoided Cost of New Generation Resources in the Annual Energy Outlook 2014” evaluated the financial cost of various electrical generation technology to produce the power we need. Researchers used complex modeling systems to determine capital costs, fixed and variable operating/maintenance costs and current subsidies to determine the Levelized Cost of Electricity (LCOE) for plants entering service in 2019. Numbers were reported in dollars per megawatt hour (MWh, a unit of energy equivalent to 1,000 kilowatts of power used continuously for one hour). Evaluating LCOE allows you to compare the cost of producing electricity across different platforms, technology and fuel sources. This is a way to “level the playing field” when comparing generation types.
U.S. average LCOE (2012 $/MWh) for plants entering service in 2019
|
Plant type |
Total system LCOE |
|
Solar thermal* |
223.6 |
|
Wind-offshore |
204.1 |
|
Solar PV* |
118.6 |
|
Integrated Coal-Gasification Combined Cycle (IGCC) |
115.9 |
|
Natural gas-fired (advanced combustion turbine) |
103.8 |
|
Biomass |
102.6 |
|
Conventional coal |
95.6 |
|
Advanced nuclear* |
86.1 |
|
Hydroelectric |
84.5 |
|
Wind |
80.3 |
|
Natural gas-fired (conventional combined cycle) |
66.3 |
|
Geothermal* |
44.5 |
Natural gas is currently cheaper than coal for generating electricity. As electric generation companies evaluate aging coal facilities and make decisions about equipment upgrades, it is easy to see why they are looking at natural gas and wind energy. Wind is a renewable resource with a competitive advantage of $80.30 per MWh. A study conducted by Archer and Jacobson in 2012 concluded that about four million turbines could power half of the world’s need for electricity by 2030. Geothermal looks very appealing for home heating use at $44.50 per MWh, but it is not technologically feasible today to generate electricity on a large scale to meet our electrical needs.
This economic analysis provides a way to compare different systems and is a valuable tool in planning future expansion and replacement of deteriorating facilities. However, this should not be the only data used to determine what technology should be employed to meet future electrical demand. Other things need to be evaluated, like waste from a nuclear plant. Hydroelectric would only provide power where there is adequate water. Access to natural resources, local zoning laws and citizen acceptance are all factors that play a role in what our future technology will be. Being educated about the benefits and tradeoffs of each system is important in making decisions. This article only sheds light on the economic differences between these systems.
Sources
- Levelized Cost and Levelized Avoided Cost of New Generation Resources in the Annual Energy Outlook 2014, U.S. Energy Information Administration
- Saturation wind power potential and its implications for wind energy, Jacobson, Mark Z. and Archer, Cristina L. Proceedings of the National Academy of Sciences of the United States of America
- U.S. Electrical Generation by Energy Source, U.S. Energy Information Administration


 Print
Print Email
Email


