Great Lakes water levels at or near seasonal highs
Lakes topping out at 7-15 inches above long term monthly averages.

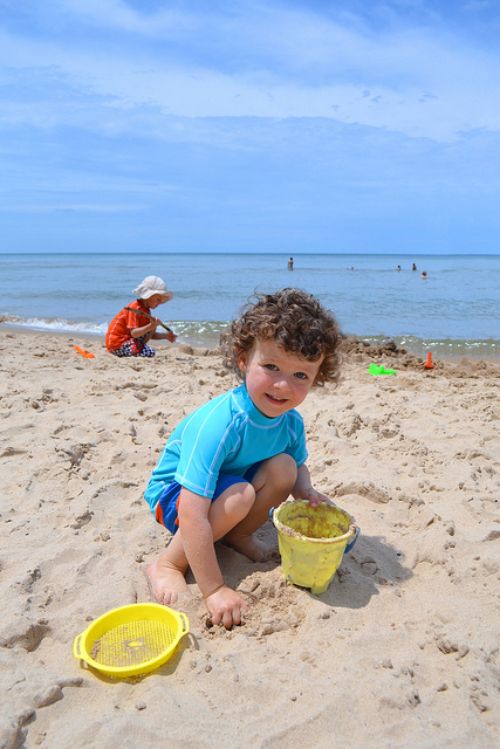
If you have visited any of the Great Lakes this summer, you will have undoubtedly noticed the lake levels, the changed beach area, and perhaps even easier access when putting a boat in at the launch. For a calendar year, Great Lakes water level heights typically peak in July or August, known as the “seasonal high” water level. This flows logically from the snowmelt, runoff, and precipitation cycles (remember back to earth science?). The lakes have probably reached their peak for 2015, with Lake Erie likely having the most interesting levels in 2015 of all the Great Lakes.
Each year, all the Great Lakes experience a “seasonal” rise and a “seasonal” decline. For instance, Lakes Michigan-Huron experience an average seasonal rise of about 12 inches up from the winter lows. This is an average over a long period of record but in some dry and below average years, such as 2012, Lake Michigan-Huron only had a seasonal rise of 4 inches. This contributed to the all time record-low levels recorded in January 2013, the lowest low since the period of record started in 1918.
Interested in in some numbers? From the July 24, 2015, information from the US Army Corps of Engineers and their “Weekly Great Lakes Water Level Update”:
Lake Superior (the headwaters!): Forecasted water level of 602.69 feet.
- 8 inches above the long term monthly average for July.
- Only 5 inches below the record highest monthly average (1950) but 29 inches above the lowest monthly average (1926).
- Up 1 inch above July 2014 levels.
Lakes Michigan-Huron (These are hydrologically the same lake with the water level the same from Georgian Bay Ontario to Chicago Illinois and joined together at the Straits of Mackinac): Forecasted level of 579.86 feet
- 7 inches above the long term monthly average for July.
- A full 26 inches below the all time record monthly high water level (1986) and yet 38 inches above the all time record monthly low (1964).
- Up 11 inches above July 2014 levels.
Lake St. Clair: Forecasted level of 575.98 feet
- 15 inches above the long term monthly average for July
- Also 15 inches below the record monthly high (1986) and 42 inches above the record monthly low (1934).
- Also up 11 inches from July 2014 levels.
Lake Erie: Forecasted level of 573.33 feet
- 17 inches above the long term monthly average for July
- 11 inches below the record monthly high (1986) and 51 inches above the record monthly low (1934).
- Up a whopping 14 inches from July 2014 levels.
Lake Ontario: Forecasted level of 246.72 feet
- 8 inches above the long term monthly average for July
- 18 inches below the record monthly high (1947) and 42 inches above the record monthly low (1934).
- Up 6 inches from July 2014.
The “net basin supply” is a technical term to include all inputs from upstream lakes, precipitation, evaporation and outflows to lower lakes. In June, 2015, all Great Lakes received above average net basin supplies with Lake Erie receiving more than triple its average net basin supply. Lake Erie has been in the news lately in the Buffalo, New York area regarding rising Lake Erie levels damaging property and swallowing beaches.
As an educator with Michigan Sea Grant and MSU Extension based on the shores of Lake Michigan, most people I talk with seem to like having the water level within a foot of the long term average— the so-called “sweet spot” —where there seem to be few problems (contrast with severe issues at very low water levels and very high water levels). While some folks may talk about less beach than last year or recent past years, with Michigan-Huron being 7 inches above the long term average, today’s level is really in the heart of the sweet spot.
Please go out to visit and enjoy the opportunities the Great Lakes afford during these summer months; the levels will slowly decline in heights for the most part the rest of the calendar year.
Michigan Sea Grant helps to foster economic growth and protect Michigan’s coastal, Great Lakes resources through education, research and outreach. A collaborative effort of the University of Michigan and Michigan State University, Michigan Sea Grant is part of the NOAA-National Sea Grant network of 33 university-based programs.


 Print
Print Email
Email

