How hot? How dry? Enviro-weather tools help answer these questions
Fruit and vegetable growers can use MSU’s Enviro-weather tools to quickly compare seasonal heat (degree-day) and moisture (precipitation) accumulations with previous years and “normal” years.
Are you wondering how the recent, hot, dry conditions are affecting your fruit or vegetable crops? It seems like we have been a lot warmer than usual, and, in many places, drier. But is this really the case? Is the growing season more advanced than it was this time last year? Will apples mature faster and pests like squash vine borer and oriental fruit moth appear sooner? These questions and more can be quickly answered by using Enviro-weather’s online tools.
We can use a measure of accumulated heat (“degree-days” or “growing degree-days”) to address the questions “are we warmer than normal?” and “is the growing season more advanced?” Temperature drives the growth of most living things (everything except the warm-blooded mammals and birds), and that includes crops, diseases and pests. That is why, in warmer years like 2012, the season comes earlier and crops grow faster and mature more quicker. Insect pests that usually appear mid-July may be found the end of June. The opposite occurs in cooler years, crop growth is delayed, and so is pest development. Degree-day accumulation mirrors development of crops and pests.
To see an overview of seasonal degree-day accumulation (base 50) across Michigan, Enviro-weather provides a “current degree day maps” tool that is accessible from any station or commodity page (Photo 1).
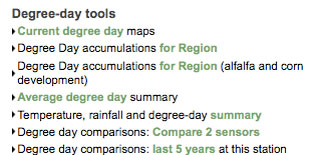
Photo 1. Enviro-weather degree-day tools.
This menu can be found on any station or
commodity page.
Clicking on the “current degree day maps” link will show you the current degree-day map that lists the degree-day accumulations (base 50) throughout Michigan. You can choose to change the dates on the pull-down menus above the map and view accumulated degree-days past dates.
Scroll down from the current degree-day map and you will see two more maps that show how far ahead or behind “normal” the season is in terms of heat (degree-days). For example, through July 9, 2012, most of Michigan is more than two weeks ahead of “normal,” though some areas are “only” one to two weeks ahead. (Photo 2)
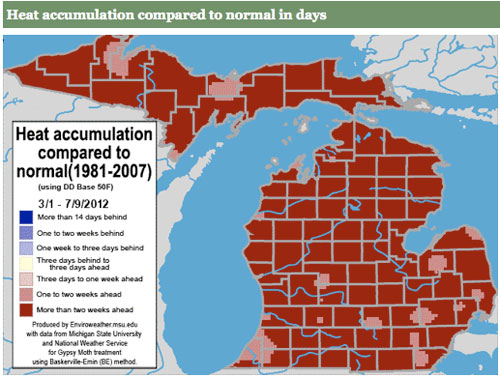
Photo 2. Map of Michigan showing heat accumulation (degree-days base
50) for March 1 through July 9, 2012, compared with “normal.” Number
of days and weeks ahead of or behind normal is shown.
In contrast, on July 9, 2011, the growing season was progressing normally in most areas of Michigan. Some areas in northern and southwest Michigan were behind normal, while a few areas were slightly ahead of normal (Picture 3).
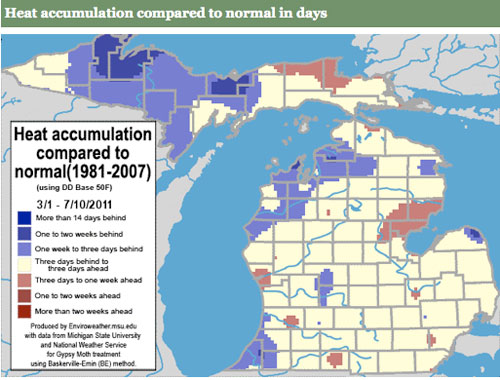
Photo 3. Map of Michigan showing heat accumulation (degree-days base 50)
for March 1 through July 9, 2011, compared with “normal.” Number of days
and weeks ahead of or behind normal is shown.
Enviro-weather users can choose to view degree-day maps for any date from 2008 to present.
There are additional tools on Enviro-weather that will display more detail for degree-days or will show precipitation information. For a listing of degree-day accumulations at an Enviro-weather station location during the past five years, select “Degree-day comparisons last 5 years at this station” (Photo 1). You will see a table listing the accumulated degree-days (base 42, 45 and 50) from March 1 through present for the current year and each of the previous five years. The “average” or normal for the past five years is also displayed. Photo 4 shows this table for Sparta, Mich. Clearly, 2012 has been warmer so far (in terms of degree-day accumulations) than any previous year since at least 2007.
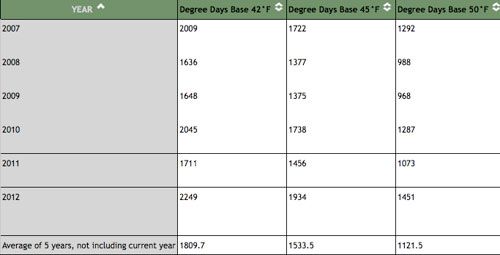
Photo 4. Degree-day accumulations from March 1 through July 10 for 2007
through 2012 at the Sparta, Mich., Enviro-weather station.
Similarly, to see a comparison of accumulated rainfall for the past five years, select “Rainfall comparisons last five years at this station” (Photo 5). This tool is available from any station or commodity page on Enviro-weather.
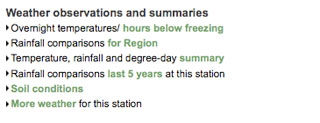
Photo 5. List of weather observations and
summaries on Enviro-weather. This menu can
be found on all station and commodity pages.
Click on this option to view a table listing total rainfall to date for the current growing season (both total inches of rain and number of hours with rain) and for the same time period during the previous five years. Here, for example, is a table for Sparta, Mich., that shows total rainfall (inches) and number of hours with rain for March 1 through July 10 of each year from 2007 to 2012 (Photo 6).
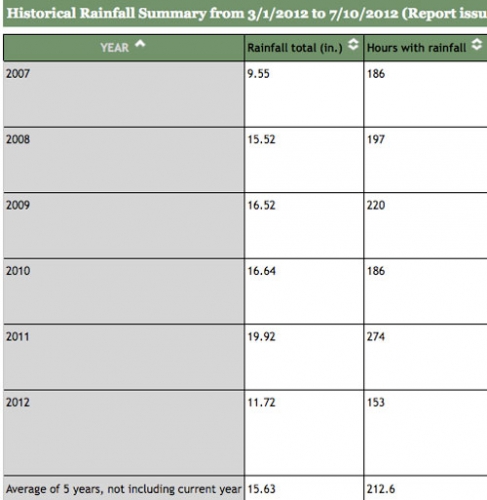
Photo 6. Rainfall totals March 1 through June 26 for 2007 through 2012
at the Sparta, Mich., Enviro-weather station.
I’ve used these Enviro-weather tools to put together a table comparing the degree-day (base 50) accumulations from March 1 through July 10 for 2007 through 2012, plus the “average” degree-days at four different locations in Michigan. Included are degree-days from the Commerce Township Enviro-weather station (southeast Michigan), Clarksville Enviro-weather station (west central Michigan), Traverse City Enviro-weather station (northwest Michigan) and the Escanaba Enviro-weather station (Upper Peninsula) (Table 1).
Table 1. Degree-day accumulations (50) from Mar 1 through Jul 9 for 2007 -2012 at four Enviro-weather stations.
|
Degree-days Base 50 |
Commerce Township |
Clarksville |
Traverse City |
Escanaba |
|
Southeast MI |
West Central MI |
Northwest MI |
Upper Peninsula MI |
|
|
2007 |
1271 |
1304 |
1173 |
902 |
|
2008 |
1067 |
1038 |
886 |
629 |
|
2009 |
997 |
961 |
811 |
632 |
|
2010 |
1346 |
1310 |
1180 |
947 |
|
2011 |
1136 |
1089 |
883 |
714 |
|
2012 |
1431 |
1473 |
1337 |
996 |
|
Average (2007 through 2011) |
1163 |
1140 |
987 |
765 |
This table shows clearly the variation in degree-day accumulations from year-to-year. It also shows that, although 2012 is the warmest of the past six years (so far) in all locations, we’ve experienced some pretty warm springs during the past five years (for example, 2007 and 2010). You can also see that how much above normal we are depends on location.
I also put together a table of rainfall totals over the past six years for the same four locations using the Enviro-weather (Table 2). Please note that these numbers reflect rainfall totals at the station. Since rainfall amounts can vary widely in a small geographical area, these numbers may not be reflective of the rainfall totals throughout the area. Nevertheless, the table shows we are drier than normal for many locations in south Michigan and wetter than normal for many locations in the north.
Table 2. Total rainfall (inches) from Mar 1 through Jul 9 for 2007 -2012 at four Enviro-weather stations.
|
Total Rainfall (inches) |
Commerce Township |
Clarksville |
Traverse City |
Escanaba |
|
Southeast MI |
West Central MI |
Northwest MI |
Upper Peninsula MI |
|
|
2007 |
10.1 |
11.1 |
7.5 |
6.0 |
|
2008 |
11.6 |
14.5 |
11.1 |
7.0 |
|
2009 |
14.7 |
14.8 |
8.1 |
9.1 |
|
2010 |
13.9 |
15.1 |
11.2 |
12.8 |
|
2011 |
16.6 |
15.0 |
11.1 |
13.2 |
|
2012 |
9.5 |
9.5 |
13.0 |
11.0 |
|
Average (2007 through 2011) |
13.4 |
14.1 |
9.8 |
9.7 |
We hope that these tools and other applications on Enviro-weather will help you manage your fruit or vegetable crops during this very challenging year. If you have questions, comments or suggestions, please contact Beth Bishop, Enviro-weather coordinator, at 517 432-6520. If you’d like to contribute to Enviro-weather, please visit the MSU gift cart.
Additional information
- MSU Extension’s Drought Resources


 Print
Print Email
Email


