Market Outlook - January 2018
 Corn
Corn
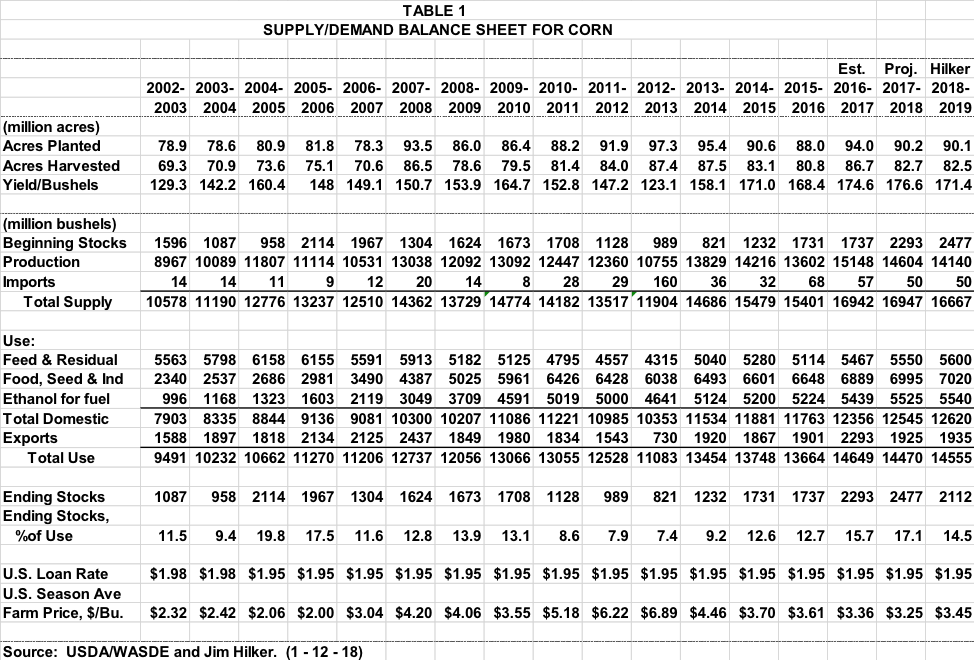
On January 12, 2018 USDA/NASS released the 2017 Annual Crop Report and December 1 Quarterly Stocks Reports. And while there were no super surprises, there were meaningful updates for the U.S. as a whole, and significant updates in the Michigan corn numbers. But none of the reports really changed the story, the U.S. and the world have a huge corn supply, and that is not likely to change soon. But there will be weather events over time which may give us decent pricing opportunities if we are ready. The Brazilian second season corn crop will start soon, and then we will have our planting season. What will the March survey of U.S. 2018 planting intentions report show? You saw my discussion in the December issue, and I have updated those numbers in the third column of the Balance Sheets below.
While 2017 corn production was down 3.6% from 2016, due to the larger beginning stocks, 2017-18 supplies are the same as 2017-17. The January report lowered planted acres 200,000 acres and harvested acres 400,000 acres, relative to the November report. However, yields were projected to be a record 176.6 bu/ac, up 1.2 bu/ac from the November projection and up 2 bu/ac from the record yield set last year. This put reported 2017 corn production at 14,604 million bushels 26 million bushels up from the November Projection. The U.S. has now had its four highest yields the past four years, as well as production.
Michigan’s 2017 yield was projected to be 159 bu/ac, the third highest on record and up 2 bu/ac from 2016. Michigan’s record yield is 162 bu/ac set in 2015. Michigan planted 2.25 million acres and harvested 1.890 million acres, both 150,000 acres less than last year. And about 200,000 acres less than the 10 year averages.
USDA/WASDE incorporated the above changes along with the information gathered from the quarterly stocks reported in the January 12 Supply/Demand monthly update and shown in the second column of Table 1. Supply was raised 25 million bushels due to the 26 million bushel increase in projected production and a slight decrease in beginning stocks. Food, seed, and industrial use was raised 10 million bushels due to more corn being used to produce glucose and dextrose. However, feed and residual use was decreased 25 million bushels based on lower than expected disappearance in the first quarter, September-November period, as reflected by the December 1 stocks report.
25 million larger supply and 15 million lower total use increased projected 2017-18 ending stocks 40 million bushels. The 2,477 million bushels ending stocks would be 17.1% of use. Higher than last year’s 15.7%, and the highest since 2005-06. The midpoint of USDA’s price forecast was $3.25.
What does this say? Without a significant increase in demand or decrease in supply, prices are not likely to vary much. And even then, the movement will be much less volatile than when stocks were much tighter from 2007-2014.
Wheat
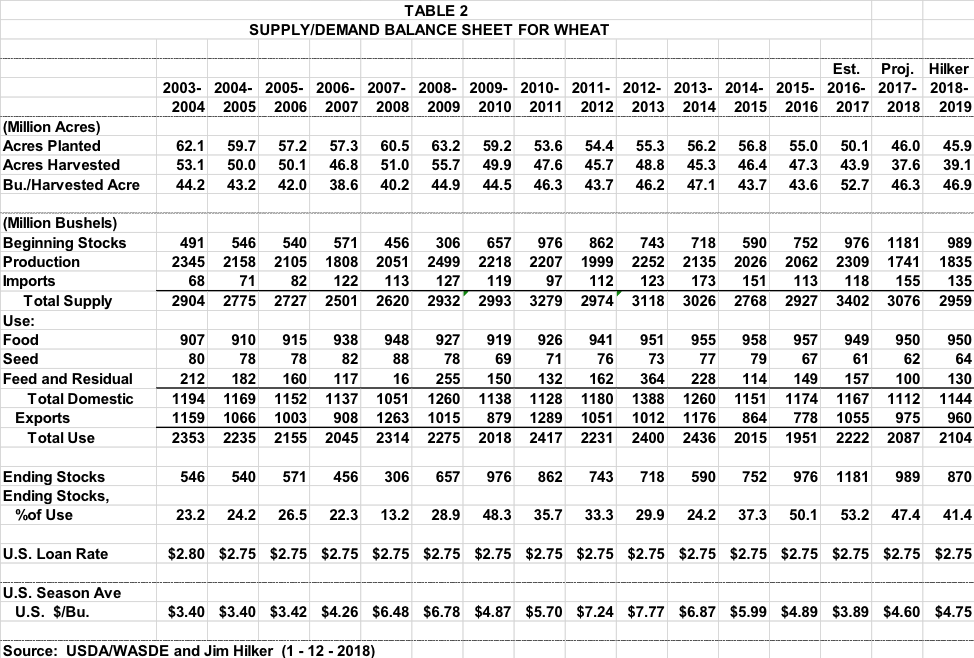
The annual crop production report did not make any changes to 2017 wheat production projections from the September Small Grains Summary. The 2017 planted acres, harvested acres, and yield are shown in the second column of Table 2. The USDA did increase the 2017-18 import projection by five million bushels, which increased projected total supply by a like amount.
However, while the 2017 production numbers remained the same, the December 1 Wheat Quarterly Stocks Report and the 2018 Winter Wheat Seeding Report differed from expectations. Based on the September-November disappearance, derived partially from the stocks report, 2017-18 feed and residual use was lowered 20 million bushels. And based on the 2018 winter wheat seeding report, which showed more acres planted than the trade expected, but less acres than the USDA seed use was based on, 2017-18 seed use was lowered 4 million bushels.
This increased the 2017-18 projected ending stocks by 24 million bushels. And put 2017-18 wheat stocks to use at 47%. However, world projected ending stocks are projected to grow. We are in a situation where pricing opportunities may be less frequent and not as pronounced as the 2007-2014 period.
The average trade expectation for winter wheat seedings was 31.4 million acres, and the survey came in showing 32.6 million, down slightly 32.7 million acres last year. So between the lower feed use, the slightly higher imports, and the larger than expected acreage futures drops around 12 cents.
However, the 32.6 million acres of winter wheat is still 100,000 acres below last year, which was the second lowest plantings since record keeping began. While the total planting did not change much, the makeup did. Hard Red Winter (HRW) wheat seeded area is expected to total 23.1 million acres, down 2 percent from 2017. Soft Red Winter (SRW) wheat seeded area totals 5.98 million acres, up 4 percent from last year. White Winter wheat seeded area totals 3.56 million acres, up 1 percent from 2017.
Michigan planted 530,000 acres of wheat, up 50,000 acres from last year when soybean harvest ran late. But down from the 610,000 acres planted for the 2016 crop.
I adjusted the total wheat planted for the 2018-19 season in last column of Table 2 to reflect the new information. Even with the increase in expected plantings, my analysis shows ending stocks will drop significantly. And while 41% of use is still quite high, coming down from 47% is meaningful.
Soybeans
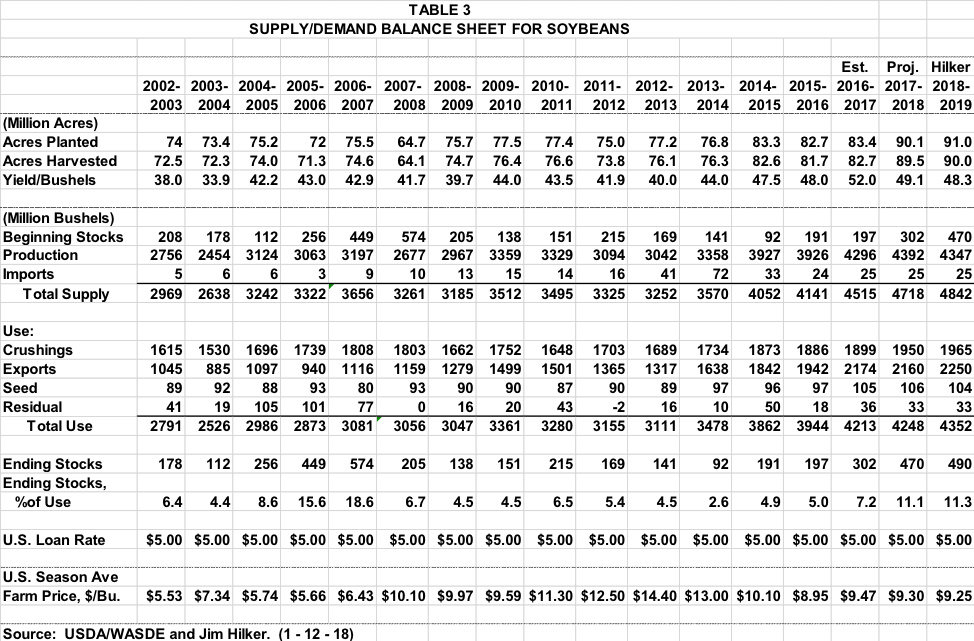
The Annual Crop Production Report did make some changes in the 2017 projections for planted an acres, and the yield which gave the futures around an 11 cent boost. The 2017 planted acres were lowered 100,000 acres to 90.1 million acres, although projected harvested acres were up fractionally at 89.5 million acres. The 2017 projected yield was lowered from 49.5 bu/ac to 49.1 bu/ac. The net was 2017 soybean production was lowered 34 million bushels, and the market liked it along with a few other things.
While the 49.1 bu/ac was lower than the November survey showed, and down from last’s year’s record of record yield of 52 bu/ac, it is still the second highest yield on record by 1.1 bu/ac. Like corn, the past four years have both the four highest yields on record, as well as the four largest soybean crops on record.
Michigan planted 2.28 million acres and harvested 2.27 million acres. Michigan’s yield was not terrible, but was a disappointing 42.5 bu/acre, the August drought hurt. The trend yield would have been near 46.5 bu/ac.
Exports to date and export sales to date have been running significantly below what was needed to meet the 2017-18 soybean export projections. The USDA lowered their export projection by 65 million bushels based on that information. They also raised projected crush 10 million bushels and lowered projected seed use 3 million bushels. The net of all this was projected ending stocks going up 24 million bushels. So what is bullish about that? Well, the trade was expecting projected ending stocks to be even higher.


Originally published in Michigan Farm Bureau's Michigan Farm News


 Print
Print Email
Email


