MSU Enviroweather tools available to help Michigan potato growers assess late blight risk and volunteer survival
 Print
Print Email
EmailLate blight tools previously hosted by the MSU potato pathology program have been upgraded and adapted, and are now available through MSU Enviroweather.
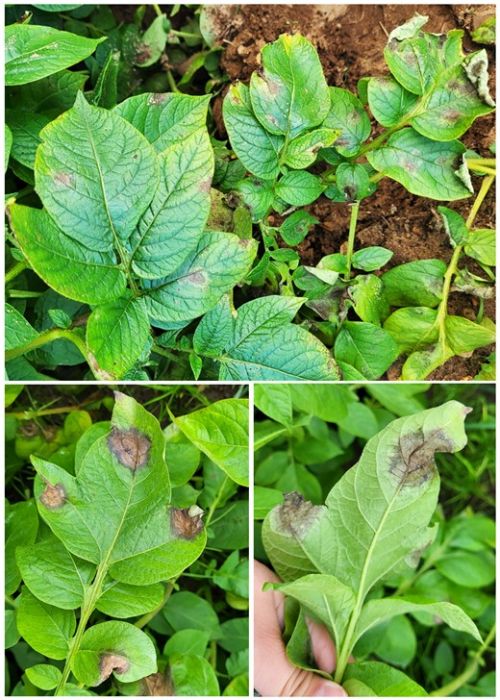
Michigan potato growers now have access to two new and updated weather-based decision support tools through MSU Enviroweather that can help support disease monitoring and management decisions throughout the production season. The Potato Late Blight Risk and Potato Volunteer Survival Risk Maps provide region-specific information derived from on-site weather station data, allowing users to monitor favorable conditions for late blight development during the growing season and assess potential for volunteer potato survival following winter.
Late blight of potato and tomato is caused by Phytophthora infestans and is a devastating disease. Symptoms include black to brown water-soaked lesions on leaves and stems with signs of white sporulation on the underside of infected leaves in high humidity (Figure 1). Under favorable conditions, susceptible crops can be destroyed within days if left untreated. Generally, optimal conditions for infection and sporulation are temperatures from 64-72 degrees Fahrenheit with high humidity or leaf wetness, but sporulation can occur between 37-79 F.
Potato Late Blight Risk Map
The Potato Late Blight Risk Map provides weather-based estimates of conditions favorable for late blight development using temperature and relative humidity to calculate disease severity values (DSVs) (Figure 2). Late blight DSVs are generated using models developed by previous MSU studies by Baker et al. 2002: Web-Interactive Integration of Regional Weather Networks for Risk Management of Late Blight in Potato Canopies.
Unlike previous fixed-date models, the updated tool allows users to customize several important inputs, including:
- Crop emergence date
- Most recent fungicide application date
- Desired end date for the forecast
These customizable inputs allow users to evaluate disease pressure over the entire growing season, determine the amount of risk that has accumulated since the most recent fungicide application, and examine forecasted conditions in the upcoming week.
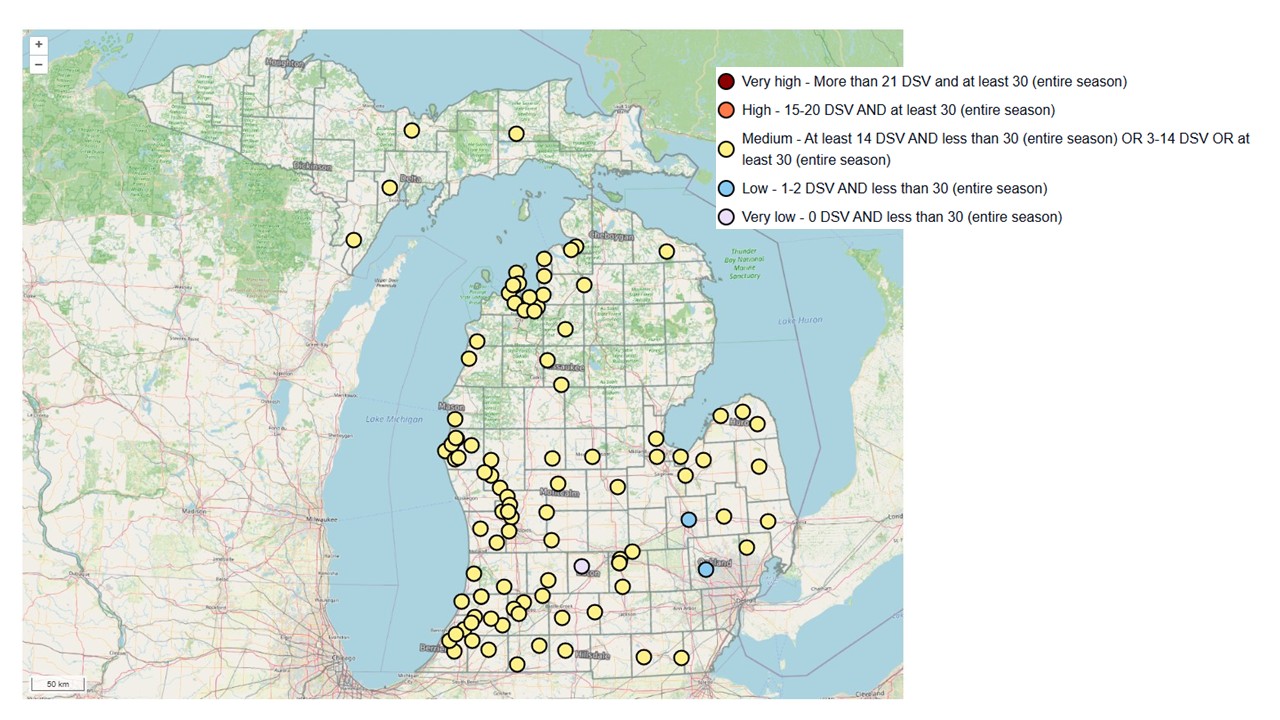
The map summarizes risk using five categories that consider both recent DSV accumulation (since last fungicide spray) and seasonal disease pressure (since emergence).
Very High Risk (red): More than 21 DSV have accumulated since the last fungicide application and at least 30 DSV have accumulated over the entire season.
High Risk (orange): Fifteen to twenty DSV have accumulated since the last fungicide application and at least 30 DSV have accumulated during the season.
Medium Risk (yellow): At least 14 DSV have accumulated since the last fungicide application while seasonal DSV remain below 30, or 3–14 DSV have accumulated since the last spray, or the season has accumulated at least 30 DSV.
Low Risk (blue): One to two DSV have accumulated since the last fungicide application and fewer than 30 DSV have accumulated during the season.
Very Low Risk (light purple): No DSV have accumulated since the last fungicide application and seasonal DSV remain below 30.
The risk map display also can be changed via dropdown menu to show 1) DSV since last spray, 2) seasonal DSV (since emergence), 3) DSV in the last 2 days, or any of these options plus a 7-day forecast over the next week (Figure 3). This option enables users to easily toggle between predicted information.
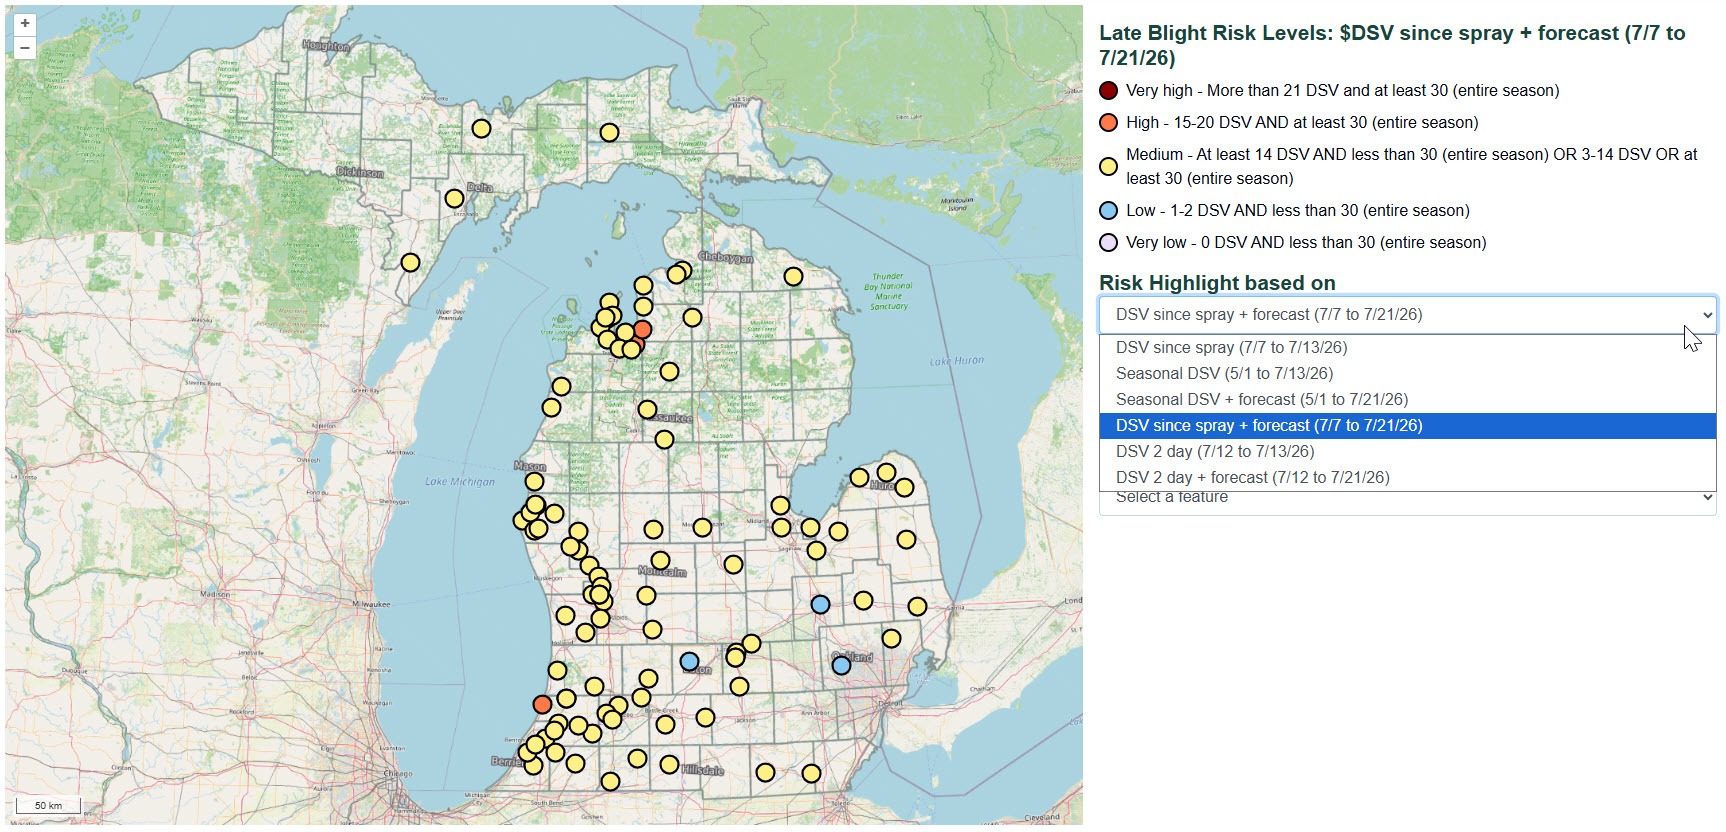
By selecting an individual weather station, users can view detailed DSV accumulation for their area and monitor changing risk throughout the season. Because the model includes forecast weather conditions, growers can anticipate favorable infection periods before they occur rather than relying solely on observed weather.
As of mid-July, no late blight has been reported in the United States or Canada in 2026. In previous year detections, US-23 has remained the prevalent Phytophthora infestans genotype and is still considered sensitive to phenylamide fungicides including mefenoxam and metalaxyl (Ridomil). Current season risk maps are available via the PlantAid Plant Health Map (previously USABlight).
Potato volunteer survival
Volunteer potato plants can create significant management challenges by serving as a bridge between crops for diseases such as late blight and potato viruses, as well as insect pests. Volunteers originating from tubers left in the field after harvest can survive mild winters and emerge the following spring, making early identification of high-risk fields important for disease prevention.
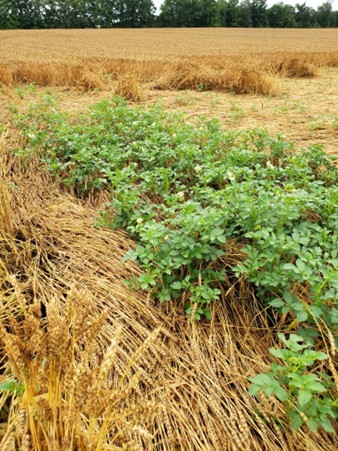
The new Potato Volunteer Survival Risk Map is based on previous studies at MSU (Kirk 2003; Wharton and Kirk 2008) and estimates the likelihood of volunteer tuber survival using winter soil temperature data collected by MSU Enviroweather stations. The model tracks the cumulative number of hours that soil temperatures remain below 27 F at both the 2-inch and 4-inch soil depths throughout the winter.
Risk is categorized into three levels:
| Hours below 27 F at: | ||
|---|---|---|
| 2-inch depth | 4-inch depth | Risk |
| > 120 | > 120 | Low (green) |
| > 120 | < 120 | Moderate (yellow) |
| < 120 | < 120 | High (red) |
High Risk (red): Fewer than 120 cumulative hours below 27 F at both the 2-inch and 4-inch soil depths, indicating a high likelihood that volunteer tubers survived the winter.
Moderate Risk (yellow): More than 120 cumulative hours below 27 F at the 2-inch depth, but fewer than 120 hours at the 4-inch depth. Under these conditions, shallow tubers are expected to experience greater winter mortality while deeper tubers may survive.
Low Risk (green): More than 120 cumulative hours below 27 F at both soil depths, suggesting most volunteer tubers were exposed to lethal temperatures during the winter.
Volunteer Risk Map
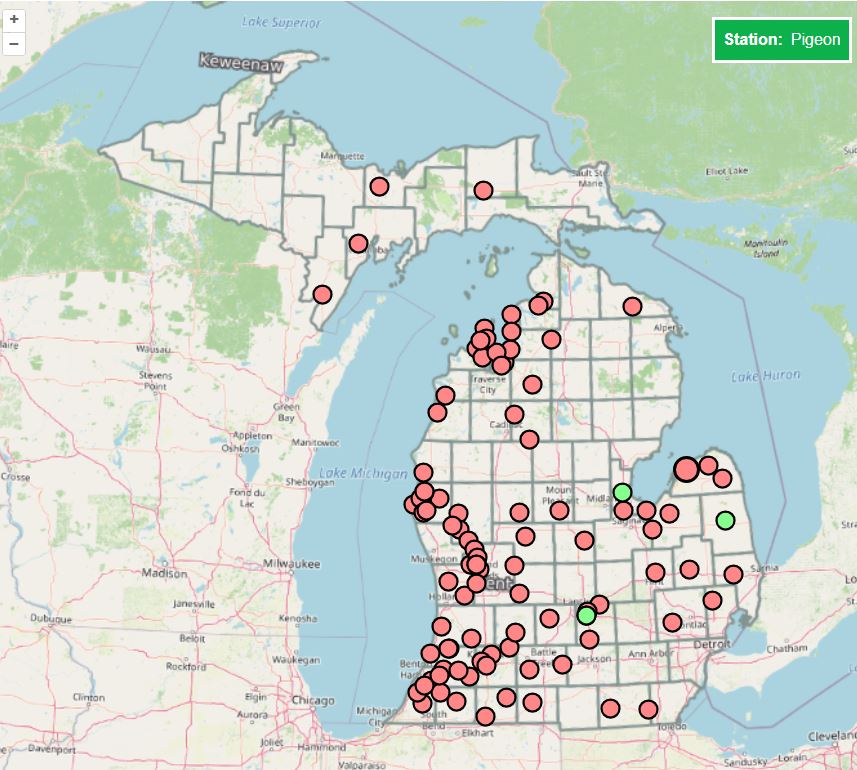
A unique feature of this tool is its historical archive. Users can review volunteer survival risk for every winter beginning in 2008, allowing comparisons among years and providing valuable context for understanding volunteer pressure following particularly mild or severe winters.
Based on winter conditions from 2025-2026, potato volunteer risk was predicted to be high throughout Michigan. Despite colder air temperatures, soil conditions were not cold enough for long enough to prevent volunteer survival. In the future, the volunteer survival map can be used to prioritize scouting efforts, identify fields where volunteer management may be especially important, and evaluate potential sources of inoculum before the growing season begins.
Disclaimer: These tools are in development and being evaluated in 2026. Tools should be used in combination with existing scouting and monitoring approaches. Please contact Jaime Willbur at willbur1@msu.edu or Keith Mason at eweather@msu.edu or 517-432-6520 with questions or comments.
Additional information about late blight risk, volunteer survival, and the research behind these tools is available at our FAQs page.
Please contact MSU Potato and Sugar Beet Pathology at willbur1@msu.edu or 517-355-4754 or MSU Plant and Pest Diagnostics at pestid@msu.edu or 517-355-4536 to report potential late blight detections or visit our websites for more information.