Nitrogen rate trial results in Michigan’s Thumb
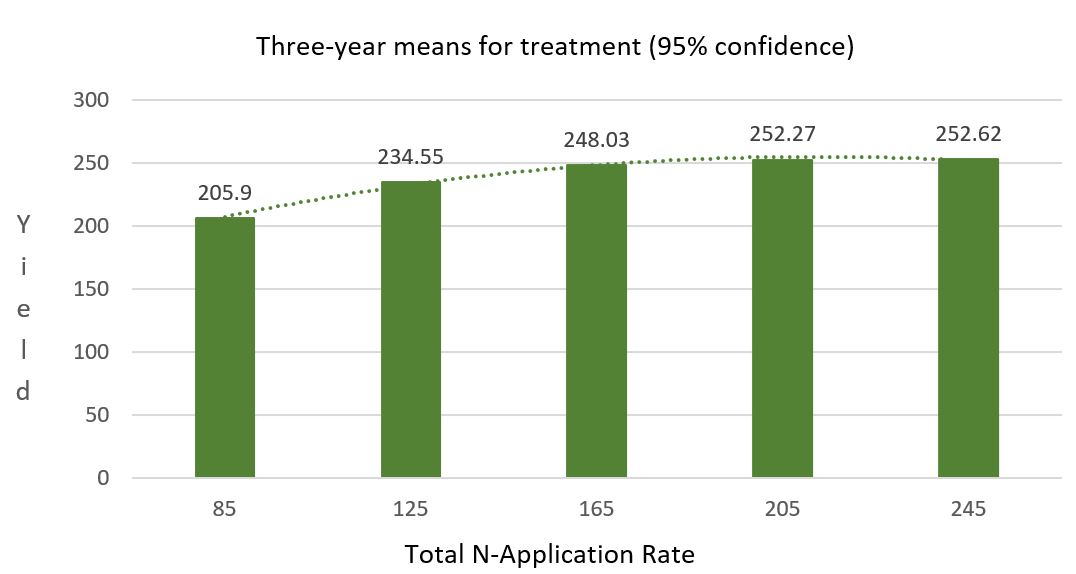
A three-year nitrogen application rate study shows little difference between 165, 205 and 245 pounds of nitrogen applied pre-plant incorporated as anhydrous ammonia.

Tight margins, high input costs and possible government tariffs are all creating challenges for farmers. Now, add in trying to figure what is the best economic return for nitrogen (N) fertilizer rates when planning for the upcoming growing season. Aside from the expenses for land and seed, nitrogen fertilizer is one of the highest cost inputs associated with corn production.
A recent study published in the American Society of Agronomy by Tao et al. states, “…compared with other nutrients, it [nitrogen] also has the greatest effect on yield and profitability. Unfortunately, it also presents the largest risk to the environment, compared to other fertilizers, because of its high water solubility and easy transformation into nitrous oxide, one of the primary greenhouse gases.” Given this information, doesn’t it make sense to focus on how you allocate your hard-earned dollars for nitrogen fertilizer?
During the 2018 growing season, on-farm strip trials were conducted in the Thumb of Michigan by Michigan State University Extension. This work concluded a three-year study focusing on nitrogen application rate and economic returns. Goals for the study were to determine agronomic optimum nitrogen rate (AONR), the total applied nitrogen rate that maximized grain yield with no regard to input cost, and economic optimum nitrogen rate (EONR), the total applied nitrogen rate that maximized dollar return to nitrogen for this trial.
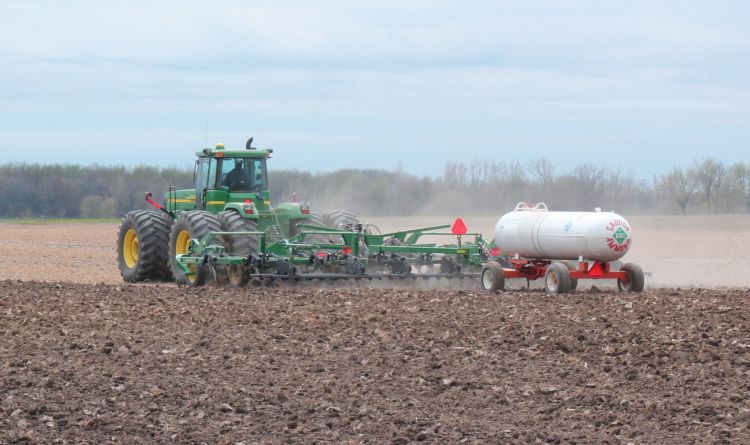
Growing conditions during this three-year period resulted in high to very high yields each year in this farming system. The trials were conducted using five total nitrogen rates ranging from 43 pounds of nitrogen (actual) to a high of 245 pounds of nitrogen (2018 growing year had no added anhydrous ammonia nitrogen at the lowest rate due to difficulties with the rate controller). Each replication was 12 rows wide, 1,000 feet long and replicated three times for each year and location. The farmer cooperator injected each treatment rate of anhydrous ammonia using a Raven rate controller on a chisel plow followed by one pass of a field cultivator. All rates of anhydrous ammonia were applied just prior to planting. A starter fertilizer with 43 pounds of actual nitrogen was applied with the planter to all treatments. The locations of the trial were in Lapeer County.
The results show no significant difference between the highest nitrogen rates of 245 pounds per acre, 205 pounds per acre and 165 pounds per acre. There were also no significant differences in corn moisture for any treatment. The results were consistent for each year of the study, even though there were variations in weather during the growing seasons.

|
Three-year average (2016-2018) at site in North Branch, Michigan. |
||||||
|---|---|---|---|---|---|---|
|
Treatment: Total N |
Anhydrous ammonia |
% MS |
*Yield Bu/A |
Gross $ Income /A |
Total NH3 cost |
$/A |
|
245 |
202 |
20.7 |
252.62 a |
$947.33 |
$53.53 |
$864.85 |
|
205 |
162 |
20.9 |
252.27 a |
$946.01 |
$42.93 |
$874.32 |
|
165 |
122 |
20.5 |
248.03 a |
$930.11 |
$32.33 |
$868.80 |
|
125 |
82 |
20.7 |
234.55 b |
$879.56 |
$21.73 |
$828.77 |
|
85 |
42 |
20.7 |
205.90 c |
$772.13 |
$11.13 |
$761.00 |
*Yield bushel per acre (Bu/A) denoted by a different letter indicate significant differences between treatments (p < 0.05).
Assumptions: $3.75 corn; $0.265 N/lb.; starter N – 43 lbs.; corn price $3.75/bu.
For more information, contact Phil Kaatz at kaatz@msu.edu or 810-667-0341.


 Print
Print Email
Email