Precision Agriculture: Making your data work for you
 Print
Print Email
EmailData is a broad term, yet in the context of precision agriculture, it is critically important. When utilized properly, data can reduce risk by driving practical, targeted solutions addressing challenges of modern farming.
Your data is important. The term data can mean many different things to different people, but in the context of precision agriculture, data refers to information about soil, crops, weather and management either in digital or analog (binders full of papers) format. Data continuously flows through every aspect of our daily lives, yet the constant influx can be overwhelming, often causing us to lose sight of just how essential data truly is. It is important to remember that data and proper data management serve as powerful tools to guide and support evidence-based decision-making in today’s diverse and evolving agricultural systems. This process of integrating these data is often referred to as digital agriculture.
Digital agriculture, data and their formats
Digital tools offer ways to integrate and synthesize data coming from a wide range of sources. A common digital format used in precision agriculture is called a generic shapefile. Developed by the Environmental Systems Research Institute (ESRI), generic shapefiles are used for geospatial data, or any type of data with a geographic reference. A shapefile is the general term with multiple files associated with a single shapefile:
Specific file types associated with a generic shapefile
|
File Type |
File Extension |
Purpose |
|
Shape-file |
.SHP |
Polygon or boundary of field and point |
|
Index-file |
.SHX |
Spatial index of the geometry in the file |
|
Database-file |
.DBF |
Database table stores the attributes for each polygon or point |
|
Projection-file |
.PRJ |
System coordinate and projection system |
A shapefile will only function properly if at least these four file types are included when loaded into software. Some programs also include additional files, but only these four (.SHP, .SHX, .DBF and .PRJ) are necessary.
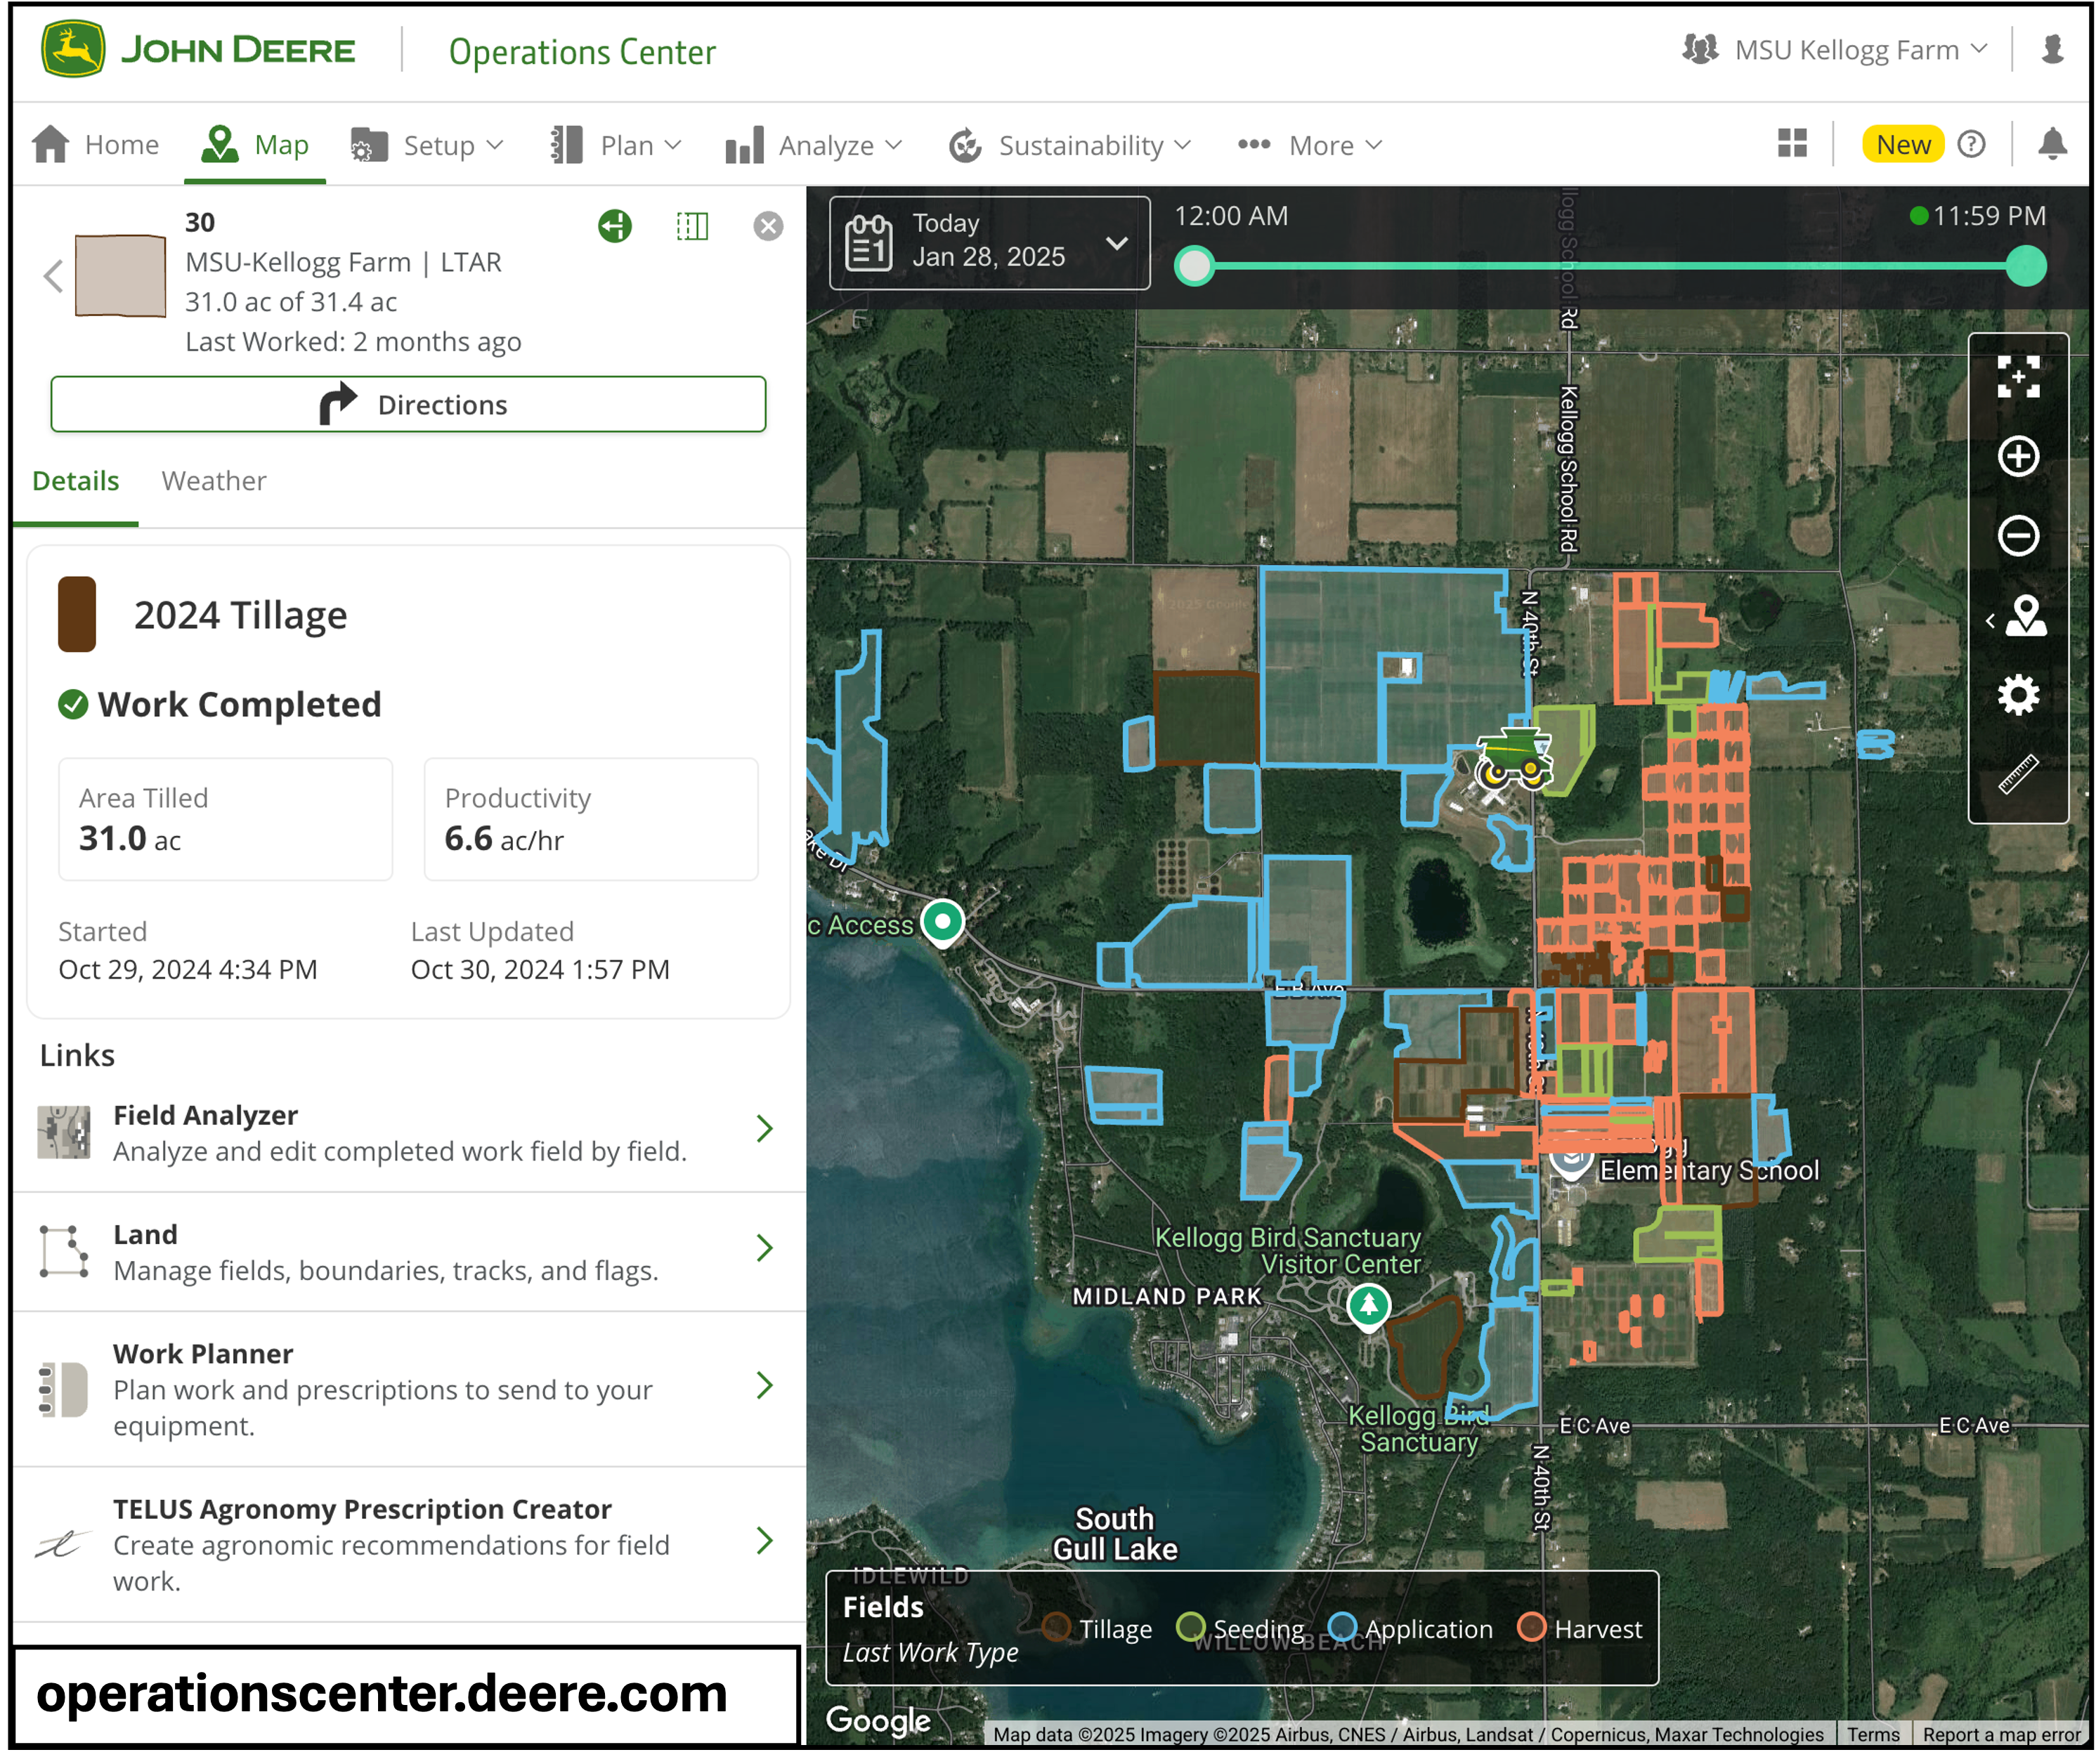
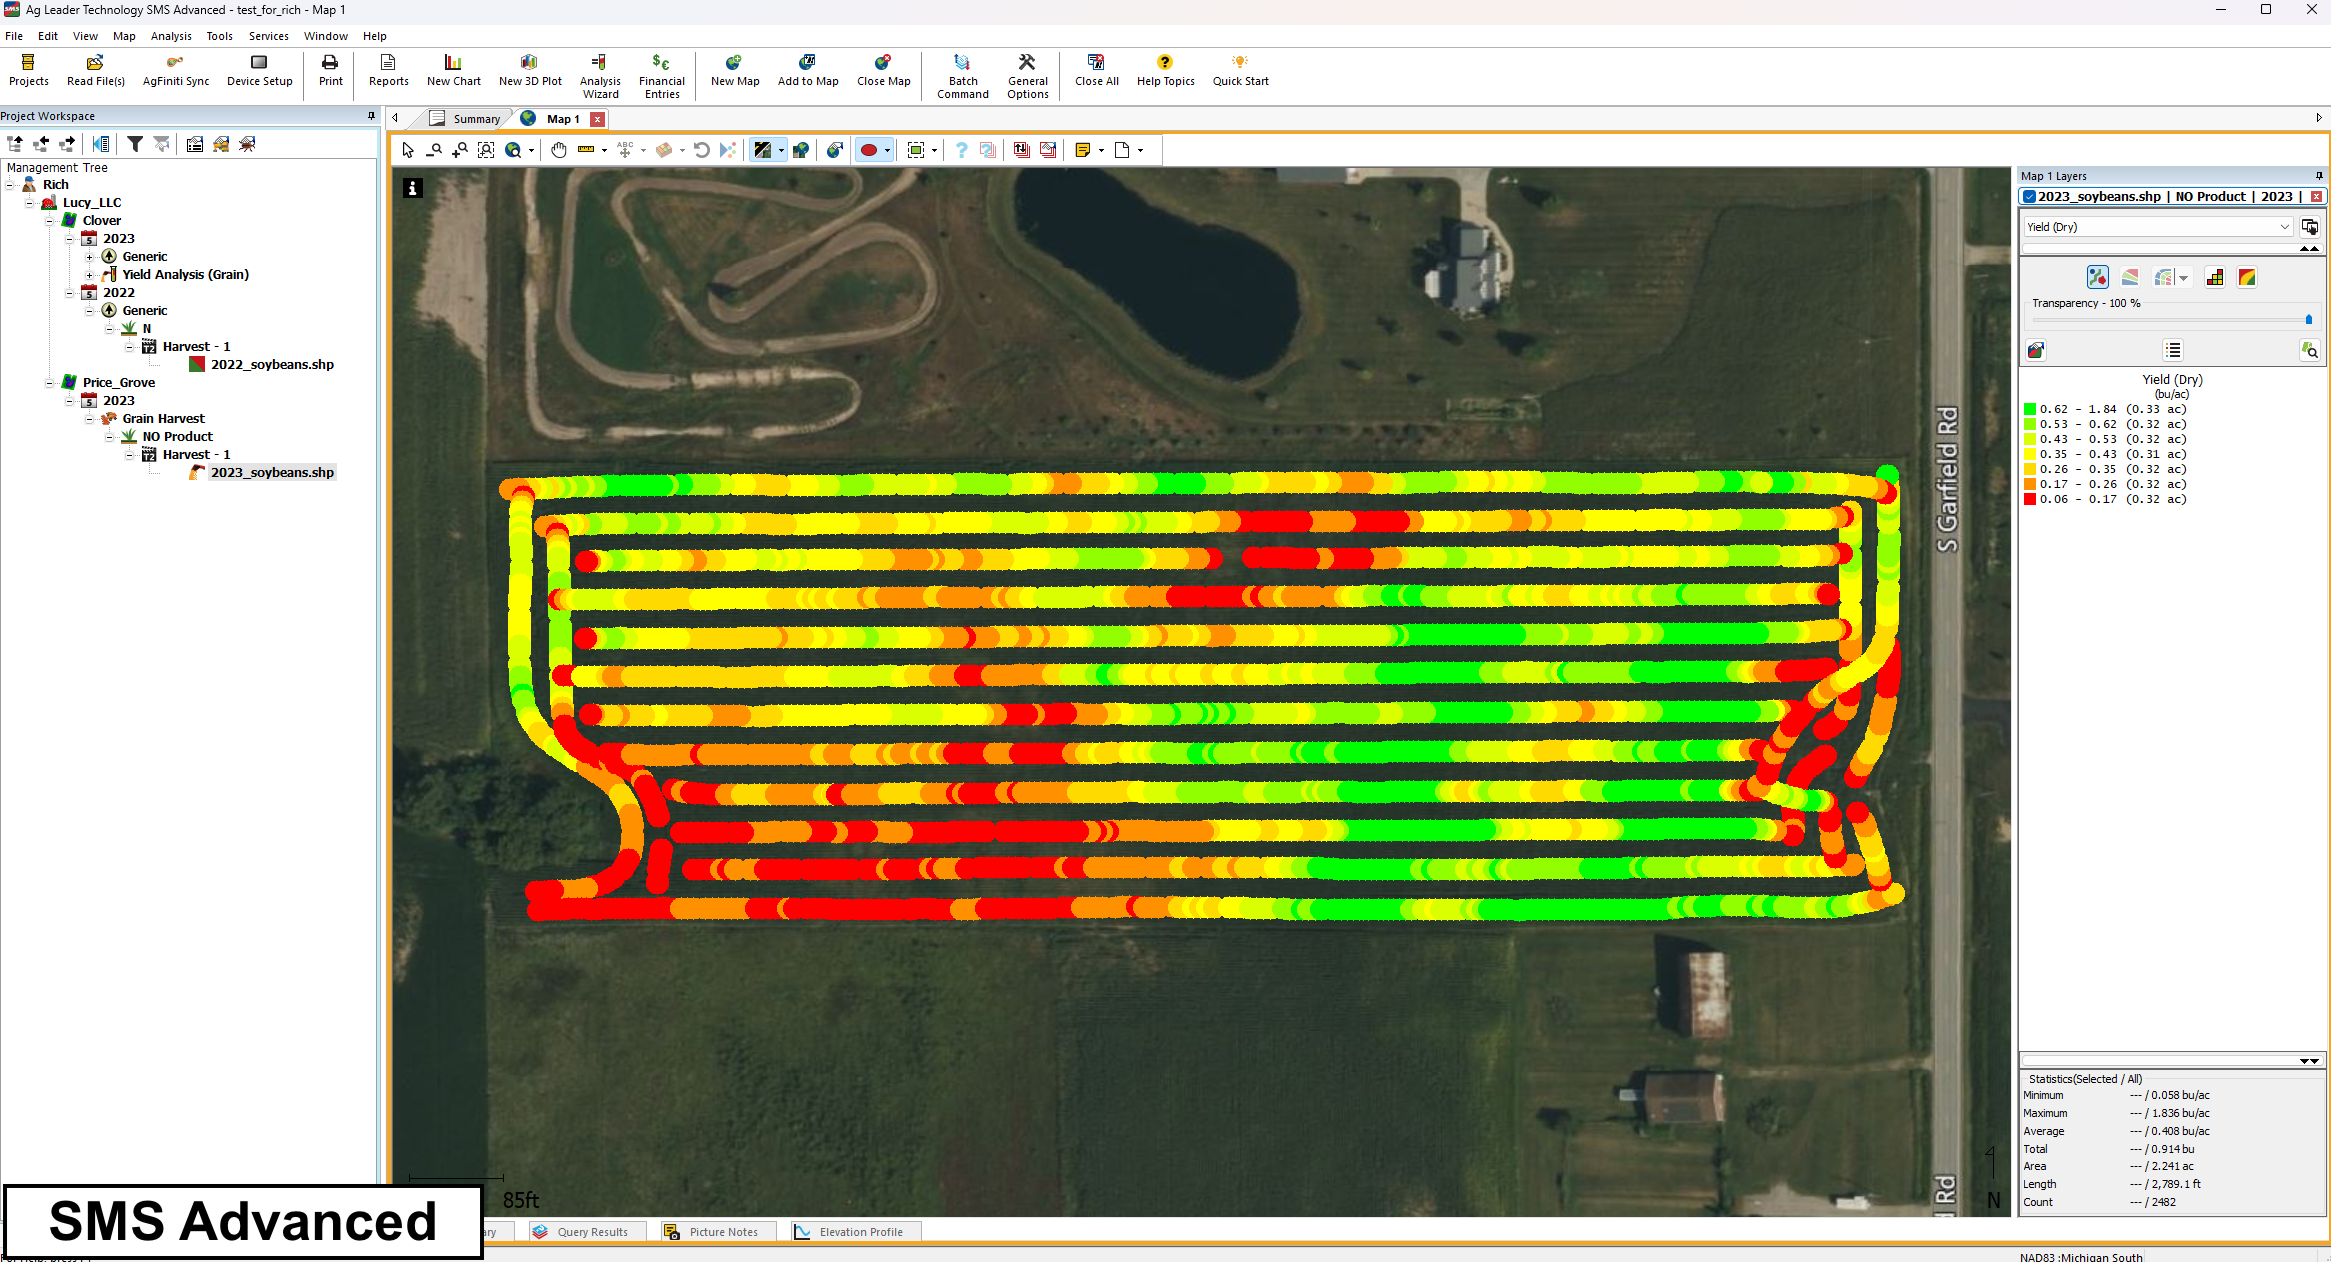
The most effective tool for processing these is Geographic Information Systems (GIS) software. Platforms such as ArcGIS and QGIS, are general-use GIS software that can import multiple layers of data to view or analyze. They can work with any form of shapefile, even those not specific to agriculture. Platforms like John Deere Operations Center (Ops Center) and AgLeader Spatial Management Software (SMS) are specialized GIS software for agricultural data. With Ops Center, the software integrates with John Deere specific hardware and catalogs farming operations like tillage, seeding, applications and harvest. AgLeader hardware (monitors) can be fit into any type of implement, however; the SMS software can accept generic shapefiles from any manufacturer.
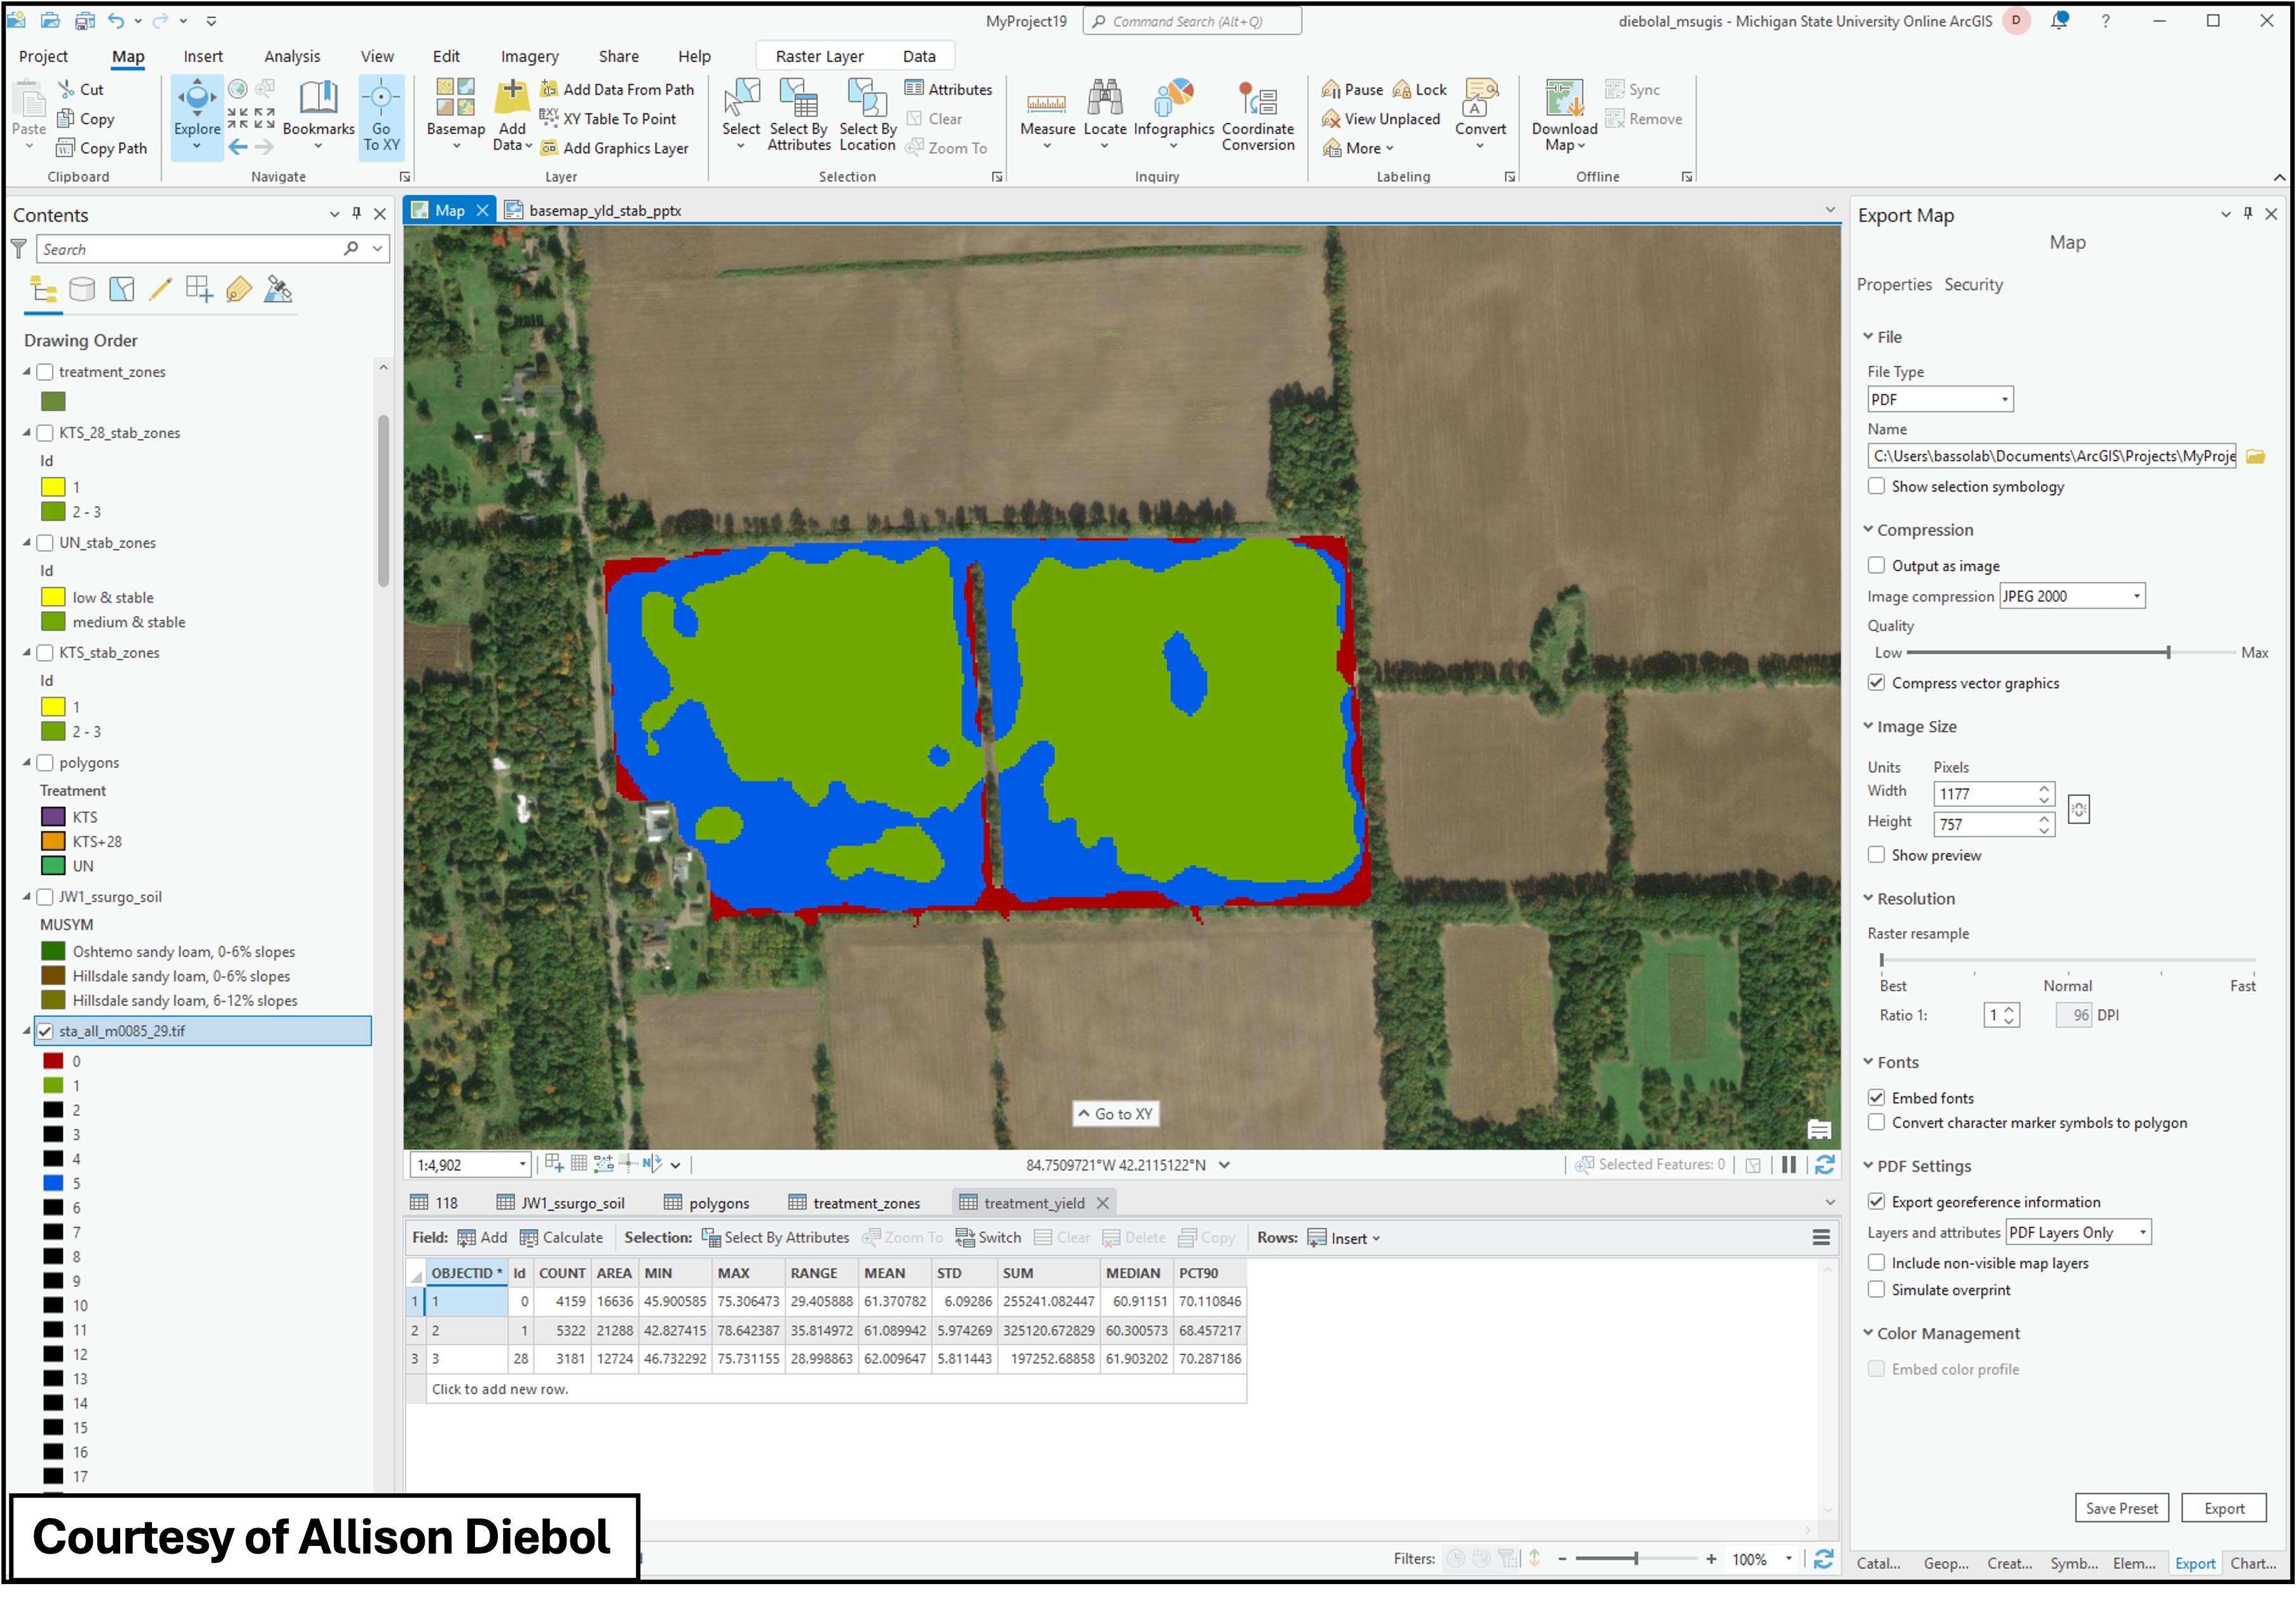
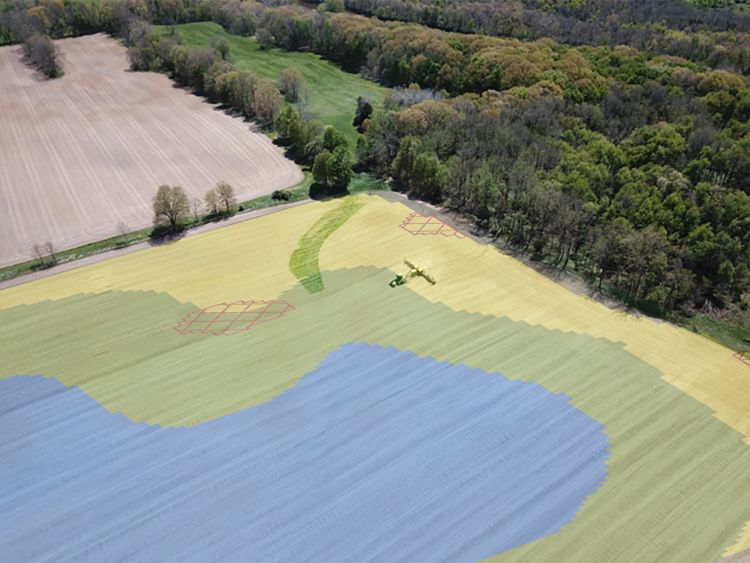
GIS allows users to view multiple shapefiles as maps layered on top of each other to better visualize these attributes with a spatial context. By integrating datasets, GIS helps reveal trends and patterns and offers deeper insights into the drivers of the spatial variations. Relying on analog formats, including maps in print collected in binders, might have worked well in the past, transitioning to digital formats significantly simplifies the processes of cataloging and consolidating multiple layers for each field. Digital formats allow the user to visualize measured soil data alongside other layers like topography which might clarify why some areas are higher or lower in any value.
While geospatial data from shapefiles may seem challenging at first, understanding the formats and their applicability can unlock valuable insights. This is far more useful than letting it sit idly in a ringed binder, gathering dust in the office or shop.
It is encouraging to see many farms adopting digital tools like GIS software to manage their data. For those who have yet to embrace the digital transformation, I encourage you to stay tuned for upcoming MSU Extension articles, factsheets and bulletins which will provide more clarity in using these tools with focus on data related to soils, plants, weather, and management. The future of farming lies in leveraging technology to make smarter, more efficient decisions. MSU Extension does not endorse any brands, they are used as examples in this article to assist our readers.