Over the past three decades, crop insurance has moved from periphery to limelight on the United States Farm and Food policy stage. This article briefly overviews why and how these programs have been promoted. It also comments on uptake in Michigan. The punchline is that, although participation has expanded, interest in the state has always been and remains weaker than elsewhere in the Corn Belt and Great Plains.
Historically, private markets for insurance against crop yield and revenue loss have had limited penetration. One reason for this is the systemic nature of crop disaster risk. Other perils are also systemic, notably flood risk for homes where the federal government is also heavily involved in supporting insurance contract availability. But many risks are not systemic. Mrs. O’Leary’s cow and forest conflagrations aside, house fires tend to be isolated incidents. Burglary, automobile and personal illness also typically encounter a distinctive individual circumstance: an opportunistic villain, a drunk driver or an unfortunate DNA draw during conception. The most common causes of yield losses, however, are spatially widespread weather events such as droughts, floods and heatwaves. Insurance companies are reluctant to take on systemic risks because one bad year could lead to bankruptcy. Insurers will also be concerned about the possibility of a ‘death spiral’ whereby insured acres pose comparatively high risks, leading to successively larger premiums and lower participation until any remaining business cannot generate sufficient margins to cover the fixed costs of making contract markets.
Although understandably reluctant to do so, the federal government is well-positioned to address the systemic risk concern. It can comfortably absorb losses for one bad year and replenish reserves from premiums paid in other years. In any case, the presence of systemic risk may compel a government to act preemptively by ensuring that voluntary risk management arrangements are available at reasonable rates. With such arrangements in place, then governments may see limited further need to provide disaster assistance intended for getting a stricken region or sector back on its feet. Federal policy addressing the ‘death spiral’ takes two main approaches. A variety of subsidies are provided to promote participation so that most acres enter insurance pools. In addition, effort is made to tailor the contracts offered to grower needs. An example of this is the harvest price option which recognizes the cash flow consequences of forward contracting the crop. Systemic risk, politics and market stabilization are the primary rationales for government involvement in crop insurance.
The journey taken by the federal government to current program designs has been circuitous. Coverage has expanded across decades from limited crops and locations to near ubiquitous offerings across crop agriculture. Public support takes five general forms. An effective program has required extensive data collection and risk model development activity, so that current premium rates offered for the major crops can be, by and large, viewed as objectively fair for the coverage offered. These services have been largely provided by branches of the USDA. The government sets the rate such that indemnity payouts average out to premiums over the long run, but solicits private brokerages to deal with marketing and contract administration at that rate. In order to ensure that the brokerages don’t go broke at a rate that does not include a load to cover expenses, these firms are compensated separately by federal payments. Compensation is also provided to these firms for assuming risks that they do not transfer back to the federal government. For risks that are assumed by the federal government, losses beyond those covered by insurance premiums may need to be met. Finally, premium subsidies are provided so as to encourage participation through lowering farmer-paid prices.
Over the years, but particularly since 1994, subsidies have expanded while products have been redesigned to better address grower risk exposures. The 1990s was an important decade for farm policy around the world because World Trade Organization strictures curtailed many forms of income support interventions among organization members, but generally did not affect support for crop insurance programs. Perhaps the best example of design innovation was the development of revenue insurance products during the middle 1990s. Most federally insurance acres are now under revenue coverage products. Premium cost relief has taken many steps over the years. Commencing with implementation of 2008 Farm Bill enactments, for example, more aggregated land tracts called enterprise units receive 80% premiums on coverage up to 70% of reference revenue and/or yield.
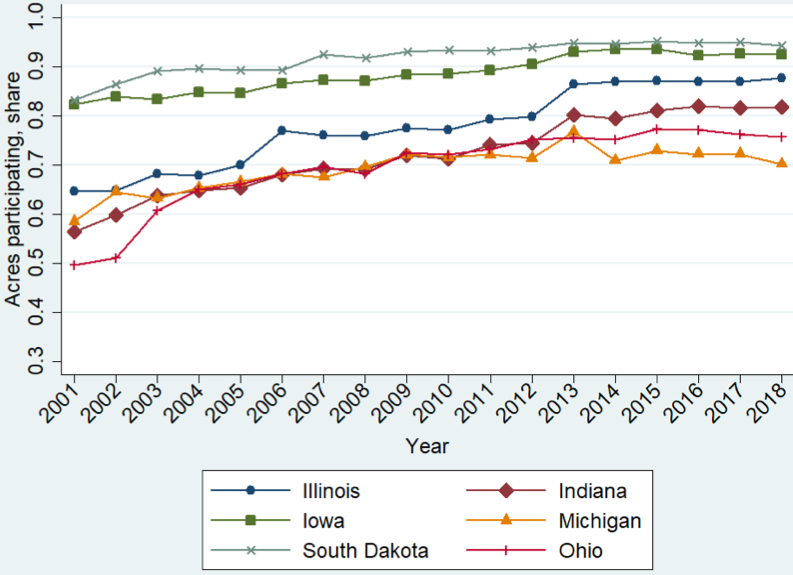
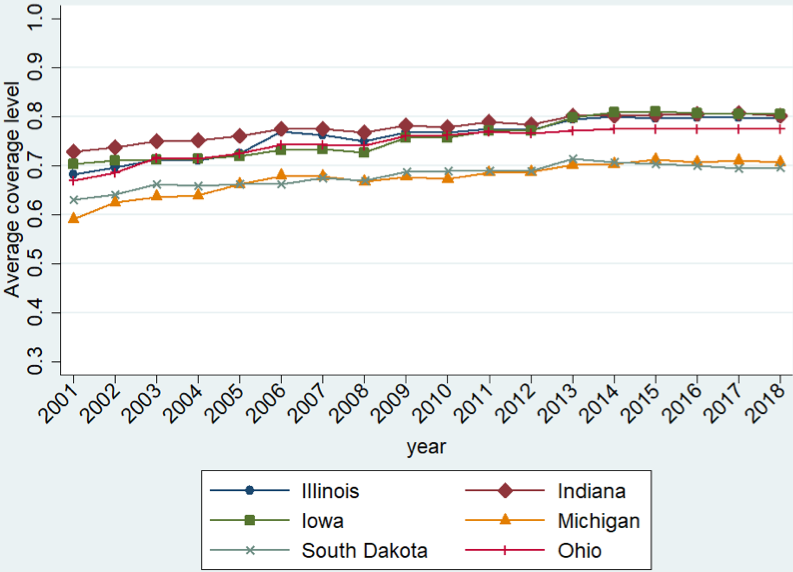
How then has participation fared in Michigan during recent decades? Figure 1 depicts corn acreage participation rates for Michigan and other representative states over the greater Midwest and Great Plains during the 2001-2018 interval. Participation has generally grown over the interval for all represented states. Acreage participation is highest in the Western Corn Belt and Great Plains, declining uniformly as one moves east. As of 2018, Michigan’s participation rate is more than 20 acres per hundred below those for South Dakota and Iowa while the numbers for soybean (not shown) show similar patterns. Conditional on participation, the mean coverage level chosen for corn is depicted in Figure 2. These numbers have also trended upward over the same interval. The geographic trend differs in one regard from Figure 1. Instead of a declining trend as one moves east from the Great Plains, mean coverage level peaks in the Central Corn Belt and declines on either side. The pattern for soybeans is similar. As of 2018, mean coverage level is about 7-10% lower in Michigan than in Iowa.
Given the high average quality of Central Corn Belt land, it is not surprising that coverage levels are higher there. Payouts at lower coverage levels will be comparatively rare on highest quality land, so if one is to insure at all then higher coverage levels make sense. Motives for Michigan’s disinclination to take out any form of coverage are not so clear. A separate analysis by the authors suggests that the state receives indemnity payouts comparable to other states, so low value for money is not likely to be the reason. Perhaps the programs are better suited to Central Corn Belt agriculture. For example, in revenue insurance contracts futures prices are used to represent prices received and so to make indemnity calculations. Futures prices are likely to better reflect market conditions in the Central Corn Belt and Great Plains, where most U.S. crops are produced, leaving revenue insurance as a less satisfactory risk management choice for Michigan. Perhaps too, mixed and part-time farming patterns dampen demand in Michigan? In any case, low participation should be a matter of concern for the state as growers may be placed at a competitive disadvantage relative to growers elsewhere.

Figure 1 Acres participating in crop insurance for corn over the period 2001-2018, measured as the fraction of total corn acres.

Figure 2 Average coverage level for corn over the period 2001-2018, measured as acreage weighted average coverage level conditional on taking out insurance.
Note: Coverage level for the CAT (i.e., catastrophic) contract is set equal to 0.5.


 Print
Print Email
Email


