The National Economics of State and Local Governments
State and local governments represent an important part of the U.S. economy generating $2.8 trillion of the U.S. GDP which is 12% of the U.S. economy.

State and local governments represent an important part of the U.S., economy. Nationally, there are over 90,000 local governments and of course the 50 state governments. These local governments consist of cities, townships, Burroughs, villages, counties, parishes, school districts and other special districts depending on the state.
State and local governments represent $2.8 trillion of the U.S. Gross Domestic Product. This amounts to 12% of the U.S. economy. In comparison, the United States government represented $1.6 trillion of U.S. GDP in 2022. The year 2010 saw state and local spending of $1.8 trillion. This means that state and local spending has increased by over $1 trillion in the last 12 years. The increase was particularly noticeable during the pandemic as the federal government transferred hundreds of billions to state and local governments from 2020 to 2022.
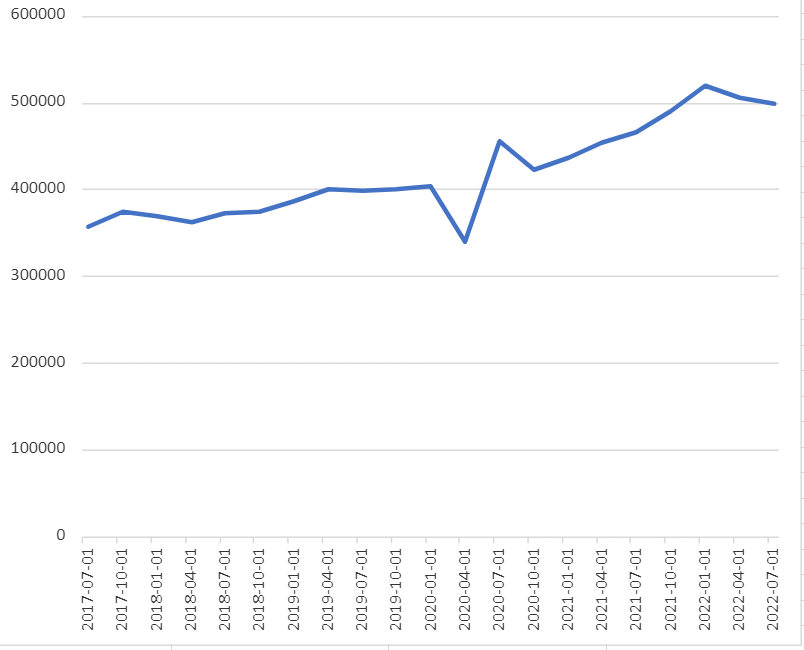
It was also true that after the core part of the pandemic in 2020, state and local own source revenues shot up substantially in 2021 and then flattened out a bit in 2022 albeit at much higher level than before. The following chart shows total own source tax revenues for state and local governments since 2017 on a quarterly basis. The big pandemic drop can be seen in quarter one of 2020 and then a large increase in the latter half of 2020 and steady growth since that period.
Chart 1: State and Local Total Tax Revenues (2017-2022 Quarterly, in millions of $)
Source: Federal Reserve Bank of St. Louis
Currently, state and local governments have some the healthiest balance sheets, at least in the short run, they have experienced in a long time. The Government accountability Office (GAO) has historically run a report on the long-term fiscal conditions of state and local governments. The last report was completed at the end of 2019 and thus does not reflect pandemic conditions and changes. The report indicates that over the next thirty years as state and local governments will run major deficits in terms of balance sheets. This will imply in their model either budget cuts or revenue increases to balance the budget long-term. The amount of the deficit varies by economic growth assumptions, pension investment returns and health care costs. Their model does indicate that even amongst the best assumptions there will still be challenges under status quo p[policies. Of course, these conditions will vary by various and state and local government entities.


 Print
Print Email
Email


