Bulletin E3489
Climate Change Impacts on Christmas Tree Production in the Midwestern Region
February 26, 2024 - Josh Bendorf, USDA Midwest Climate Hub; Bill Lindberg, Michigan State University Extension; Bert Cregg, Department of Horticulture and Forestry, Michigan State University; Deborah McCullough, Department of Entomology, Michigan State University; Gary Chastagner, Department of Plant Pathology, Washington State University; Laurie Nowatzke, USDA Midwest Climate Hub; Dennis Todey, USDA Midwest Climate Hub; Sophia Parker, USDA Midwest Climate Hub
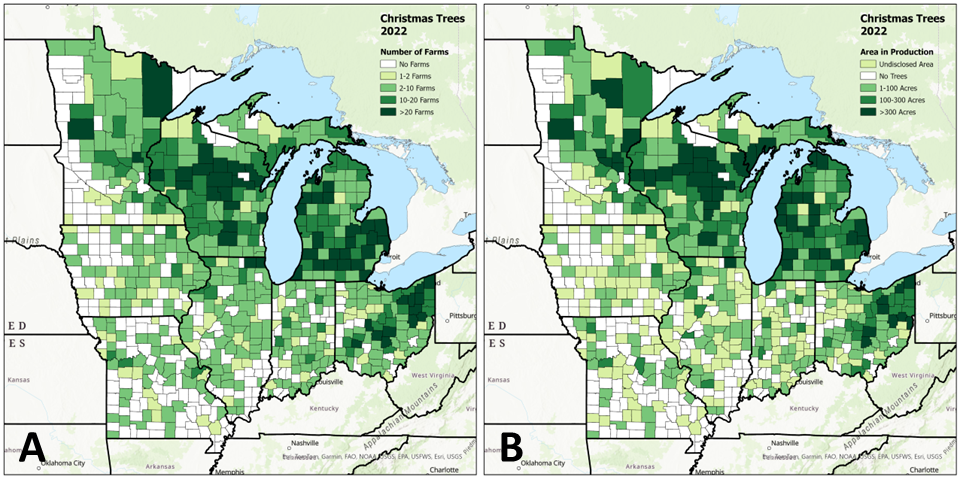
Christmas trees are a widely grown crop across the Upper Midwest (Figure 1). Christmas tree production statistics for Midwestern states (Illinois, Indiana, Iowa, Michigan, Minnesota, Missouri, Ohio, and Wisconsin) from the 2022 United States Department of Agriculture (USDA), National Agricultural Statistics Service Census of Agriculture (Quick Stats)1 indicate:
- 4,284 farms produce Christmas trees (see Figure 1a for farm distribution by county).
- Christmas trees are grown on over 73,000 acres (Figure 1b).
- Over 4 million trees are annually harvested, accounting for $81 million in revenue.
Christmas trees, like all crops, are susceptible to challenges caused by a changing climate. Currently observed changes and projected future changes will affect Christmas tree production in unique ways and producers may need to consider different practices to mitigate climate-related problems. This bulletin will discuss climate trends, expected impacts for Christmas tree production, and potential methods to mitigate these challenges.
Climate Trends
The data and trends provided in this section are a synopsis of observed changes (1979-2021) and modeled projections across the Midwest. The following assessments reflect climate models’ projected values in mid-century (2040-2059), based on a climate scenario with emissions increasing over time without substantial reductions (RCP 8.5)2,3. Projected values are compared against the 1979-2005 averages. For a detailed assessment of changes and trends in your state as well as for additional climate scenarios, refer to your state’s agriculture vulnerability assessment (https://www.climatehubs.usda.gov/hubs/midwest/topic/assessing-impacts-climate-change-midwest-agriculture) available from the USDA Midwest Climate Hub.
Growing Season Length & Freeze Events
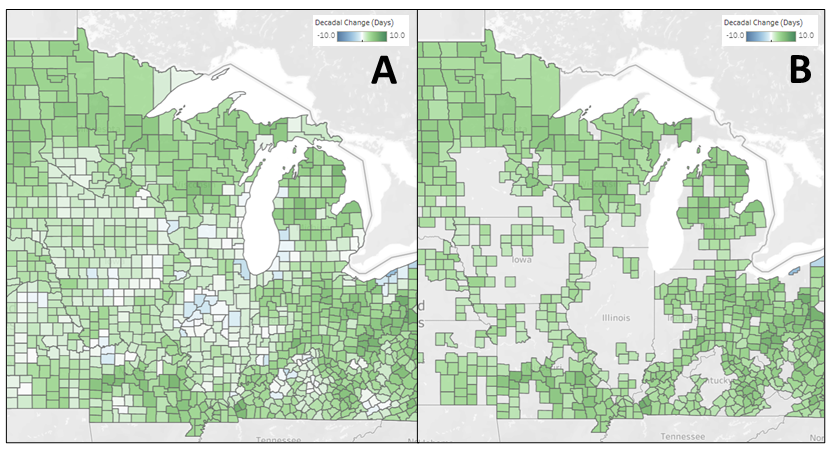
- Across the Midwest, growing seasons are getting longer (Figure 2) because of the last freeze (daily low ≤32°F [0°C]) happening earlier in the spring and the first freeze happening later in the fall4.
- To get county-specific freeze date and growing season length information for your home county, visit the Midwestern Regional Climate Center (MRCC) Freeze Date Tool (https://mrcc.purdue.edu/freeze/freezedatetool)
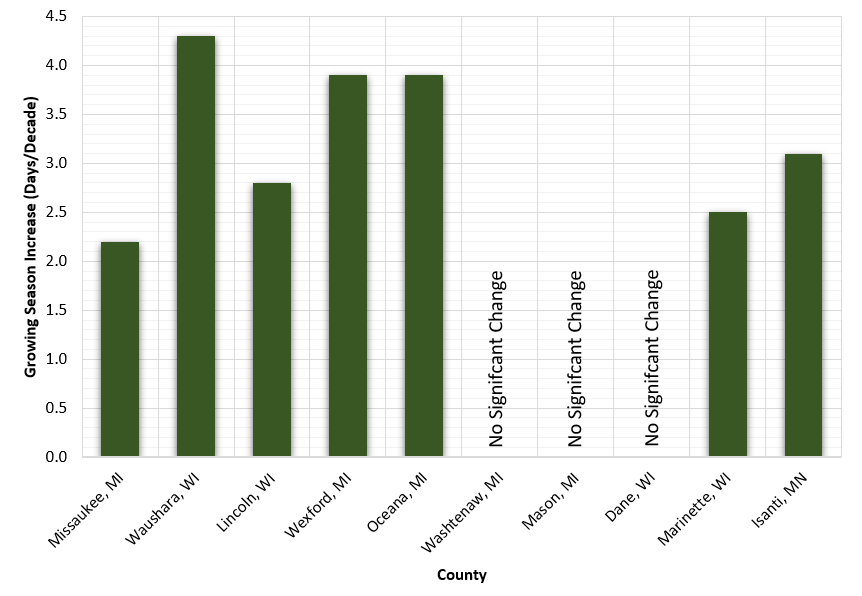
- Out of the top ten Midwest Christmas tree production counties (by acres in production) an average increase of growing season length of 3.2 days per decade has been observed (Figure 3)4.
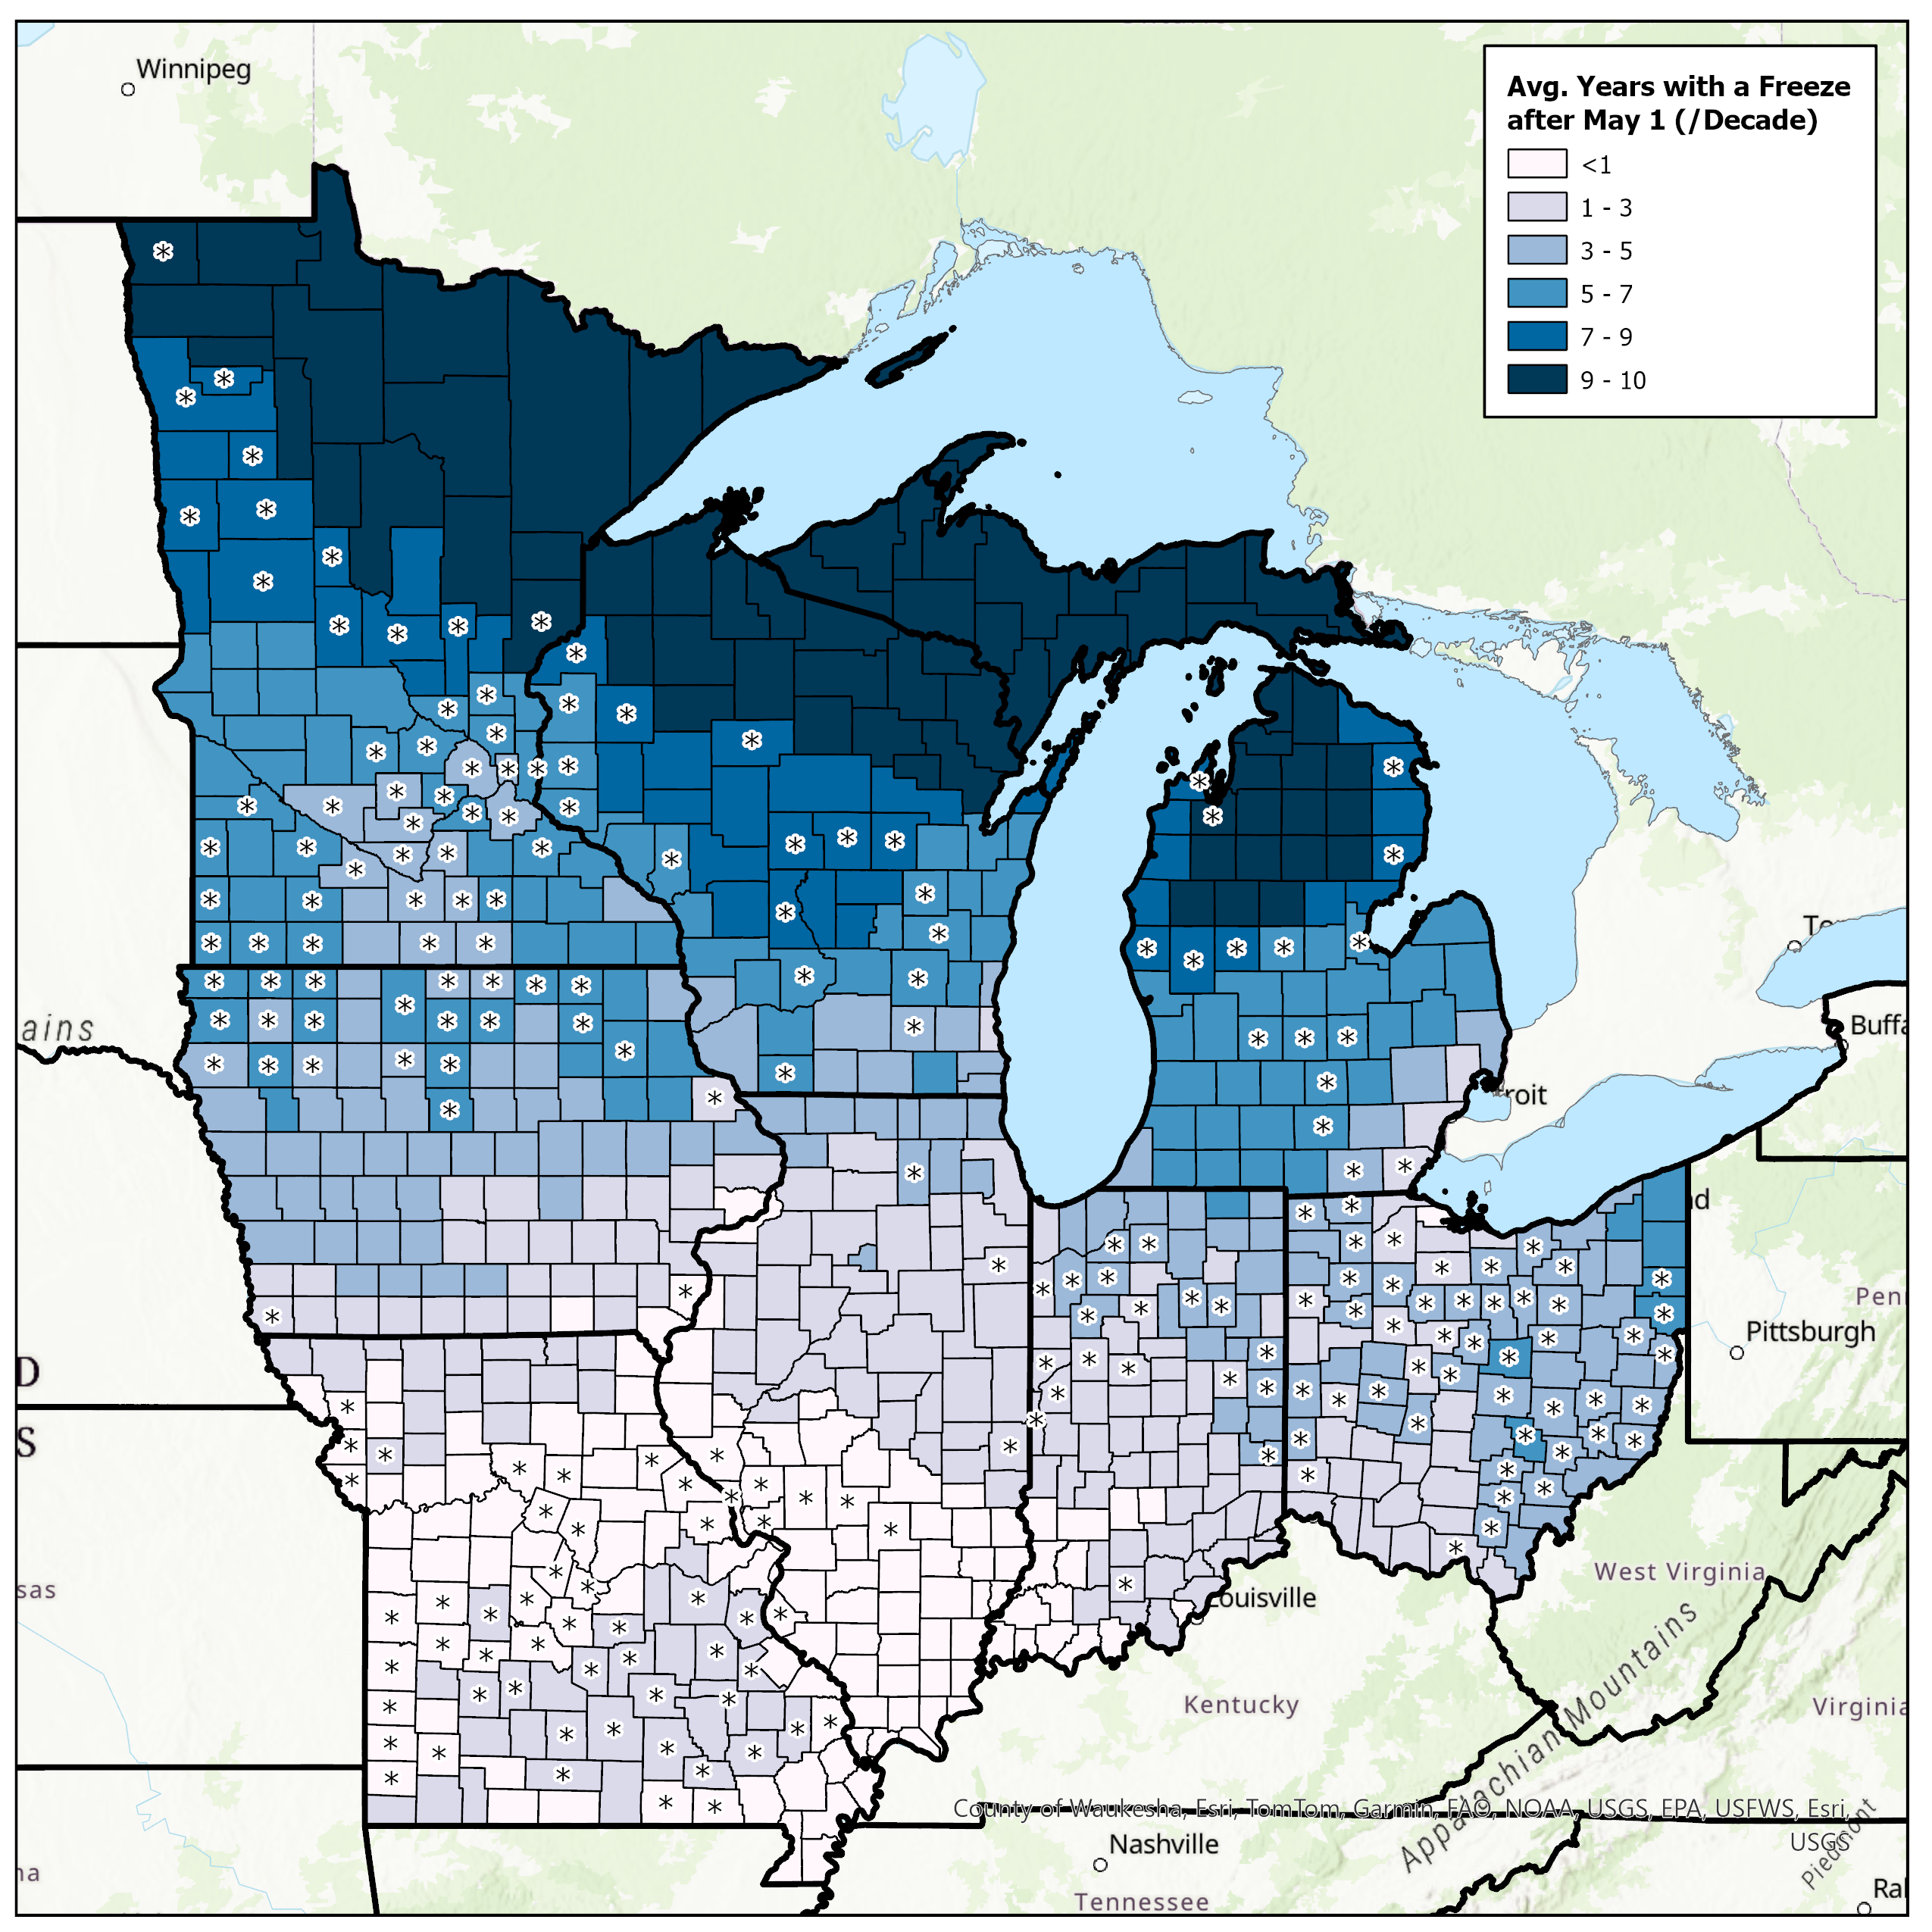
- Late-season freeze events (on or after May 1) tend to occur at a higher frequency at higher latitudes (Figure 4)4. Most counties did not see a significant trend in years with a late freeze event between 1951-2020.
- Counties with a significant decline in years with a freeze occurrence after May 1 are declining at 1 year/decade or less.
- Models suggest that the last spring freeze will continue to trend earlier in the spring by mid-century, but this date will become more variable from year-to-year5.
Temperature
Observed (1979-2021):
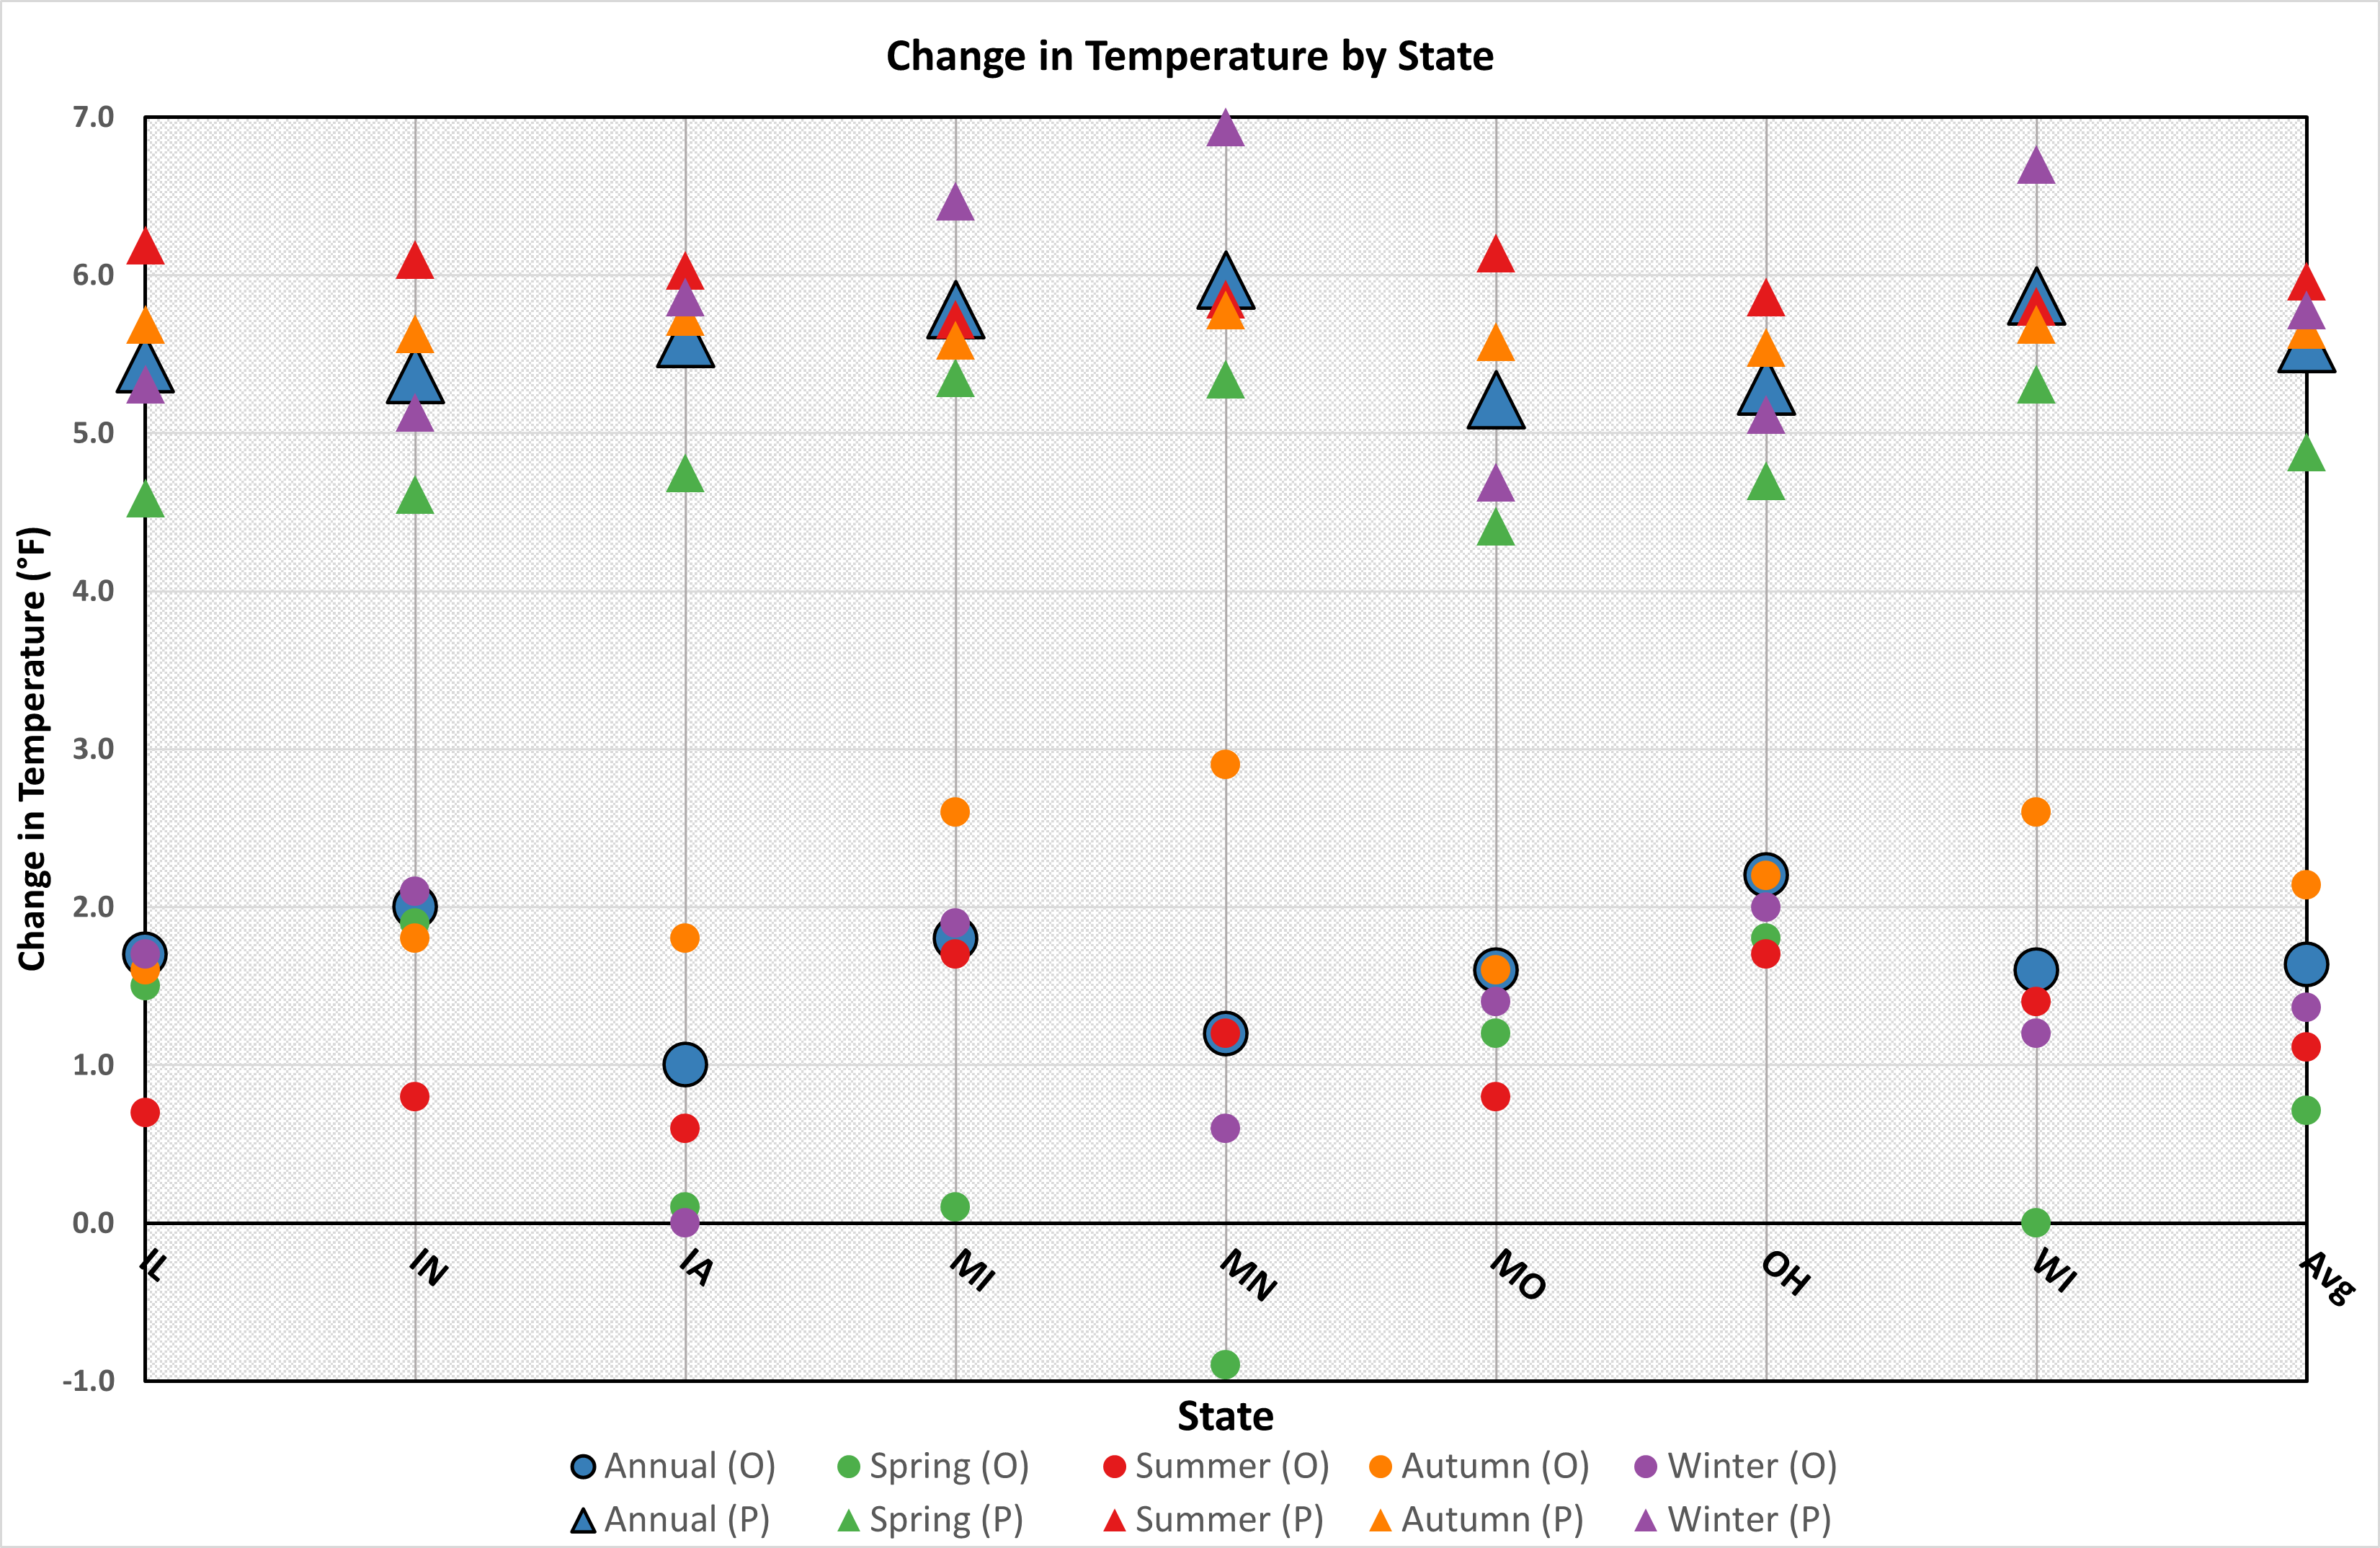
- Current average annual temperatures have increased by 1-2°F (~1°C) compared to averages from the late 1970s (Figure 5).
- Fall is the season with the highest increase in temperature (on average, 2.1°F [1.2°C]; Figure 5).
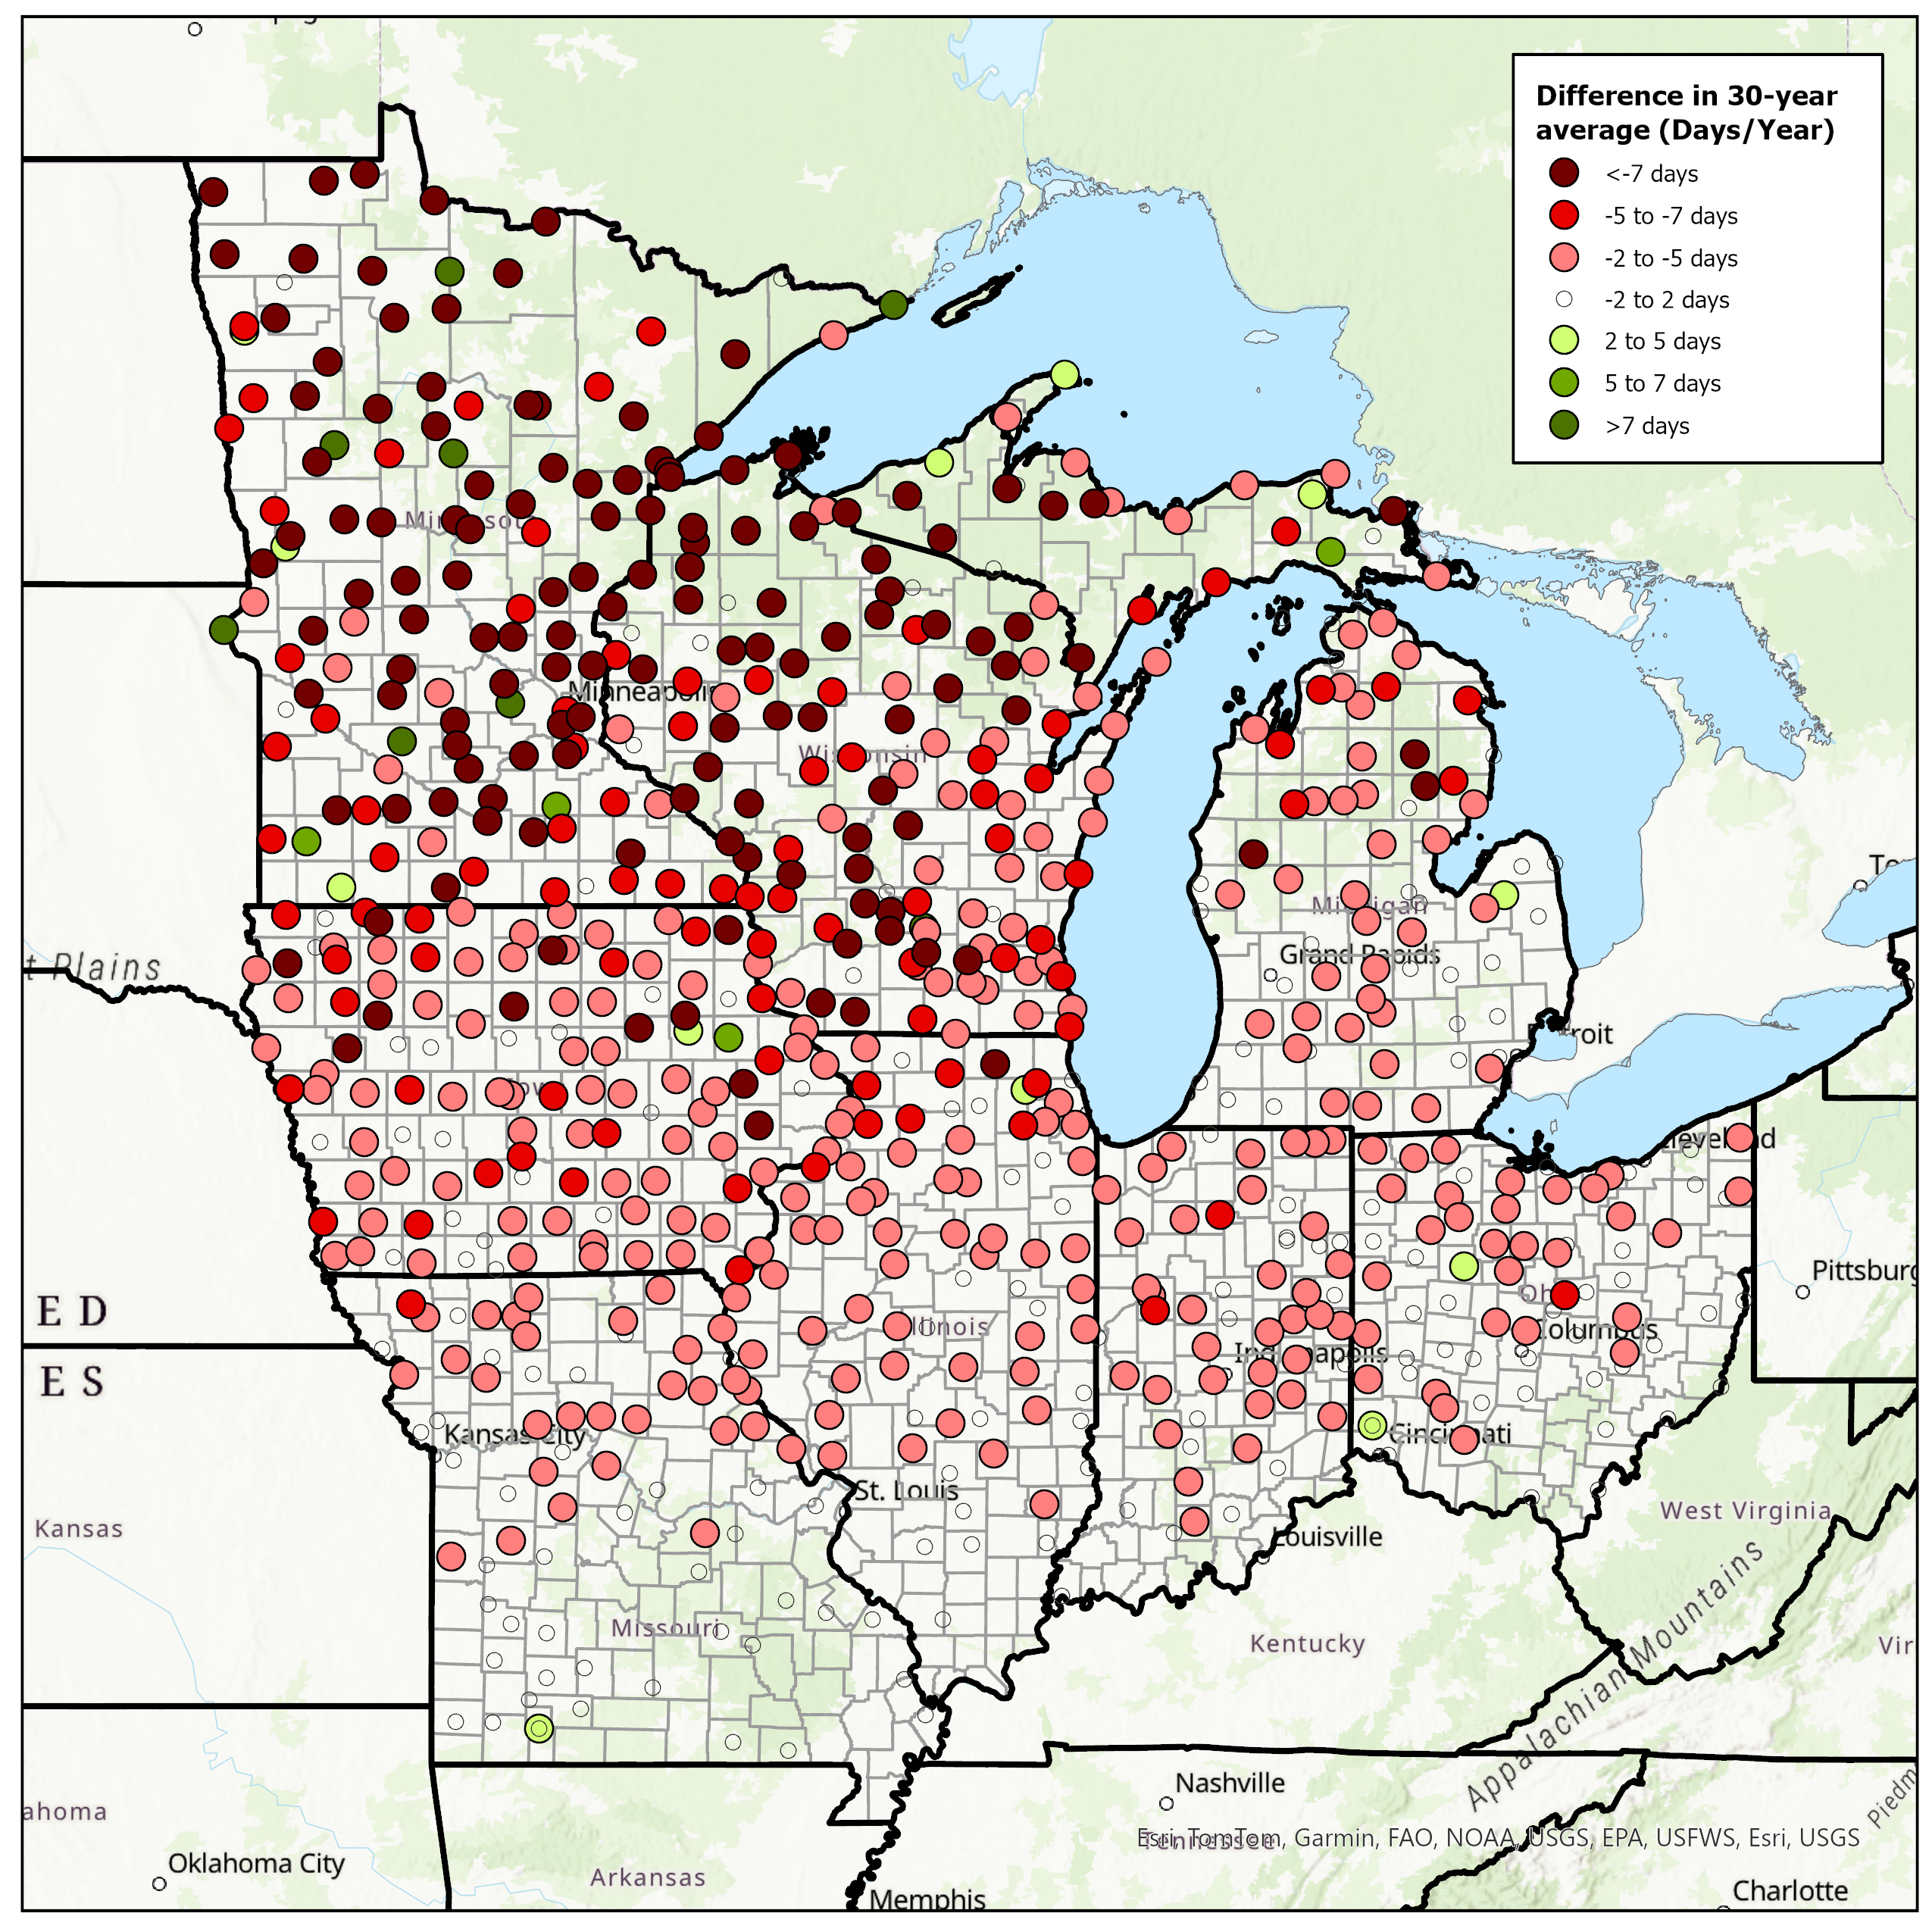
- The frequency of very cold nights (-4°F, -20°C) has been decreasing across the Midwest since the 1960s, with the highest decreases to the north and west (Figure 6)6.
Projected:
- Annual average temperatures are expected to rise by another 5-6°F (~3°C) by mid-century under a higher emission scenario (RCP 8.5; Figure 5).
- The number of days below freezing (daily low ≤32°F [0°C]) per year is expected to decrease, on average, by 36 days (Table 1).
- The number of hot days (daily high ≥86°F [30°C]) per year is expected to increase, on average, by 81 days (Table 1).
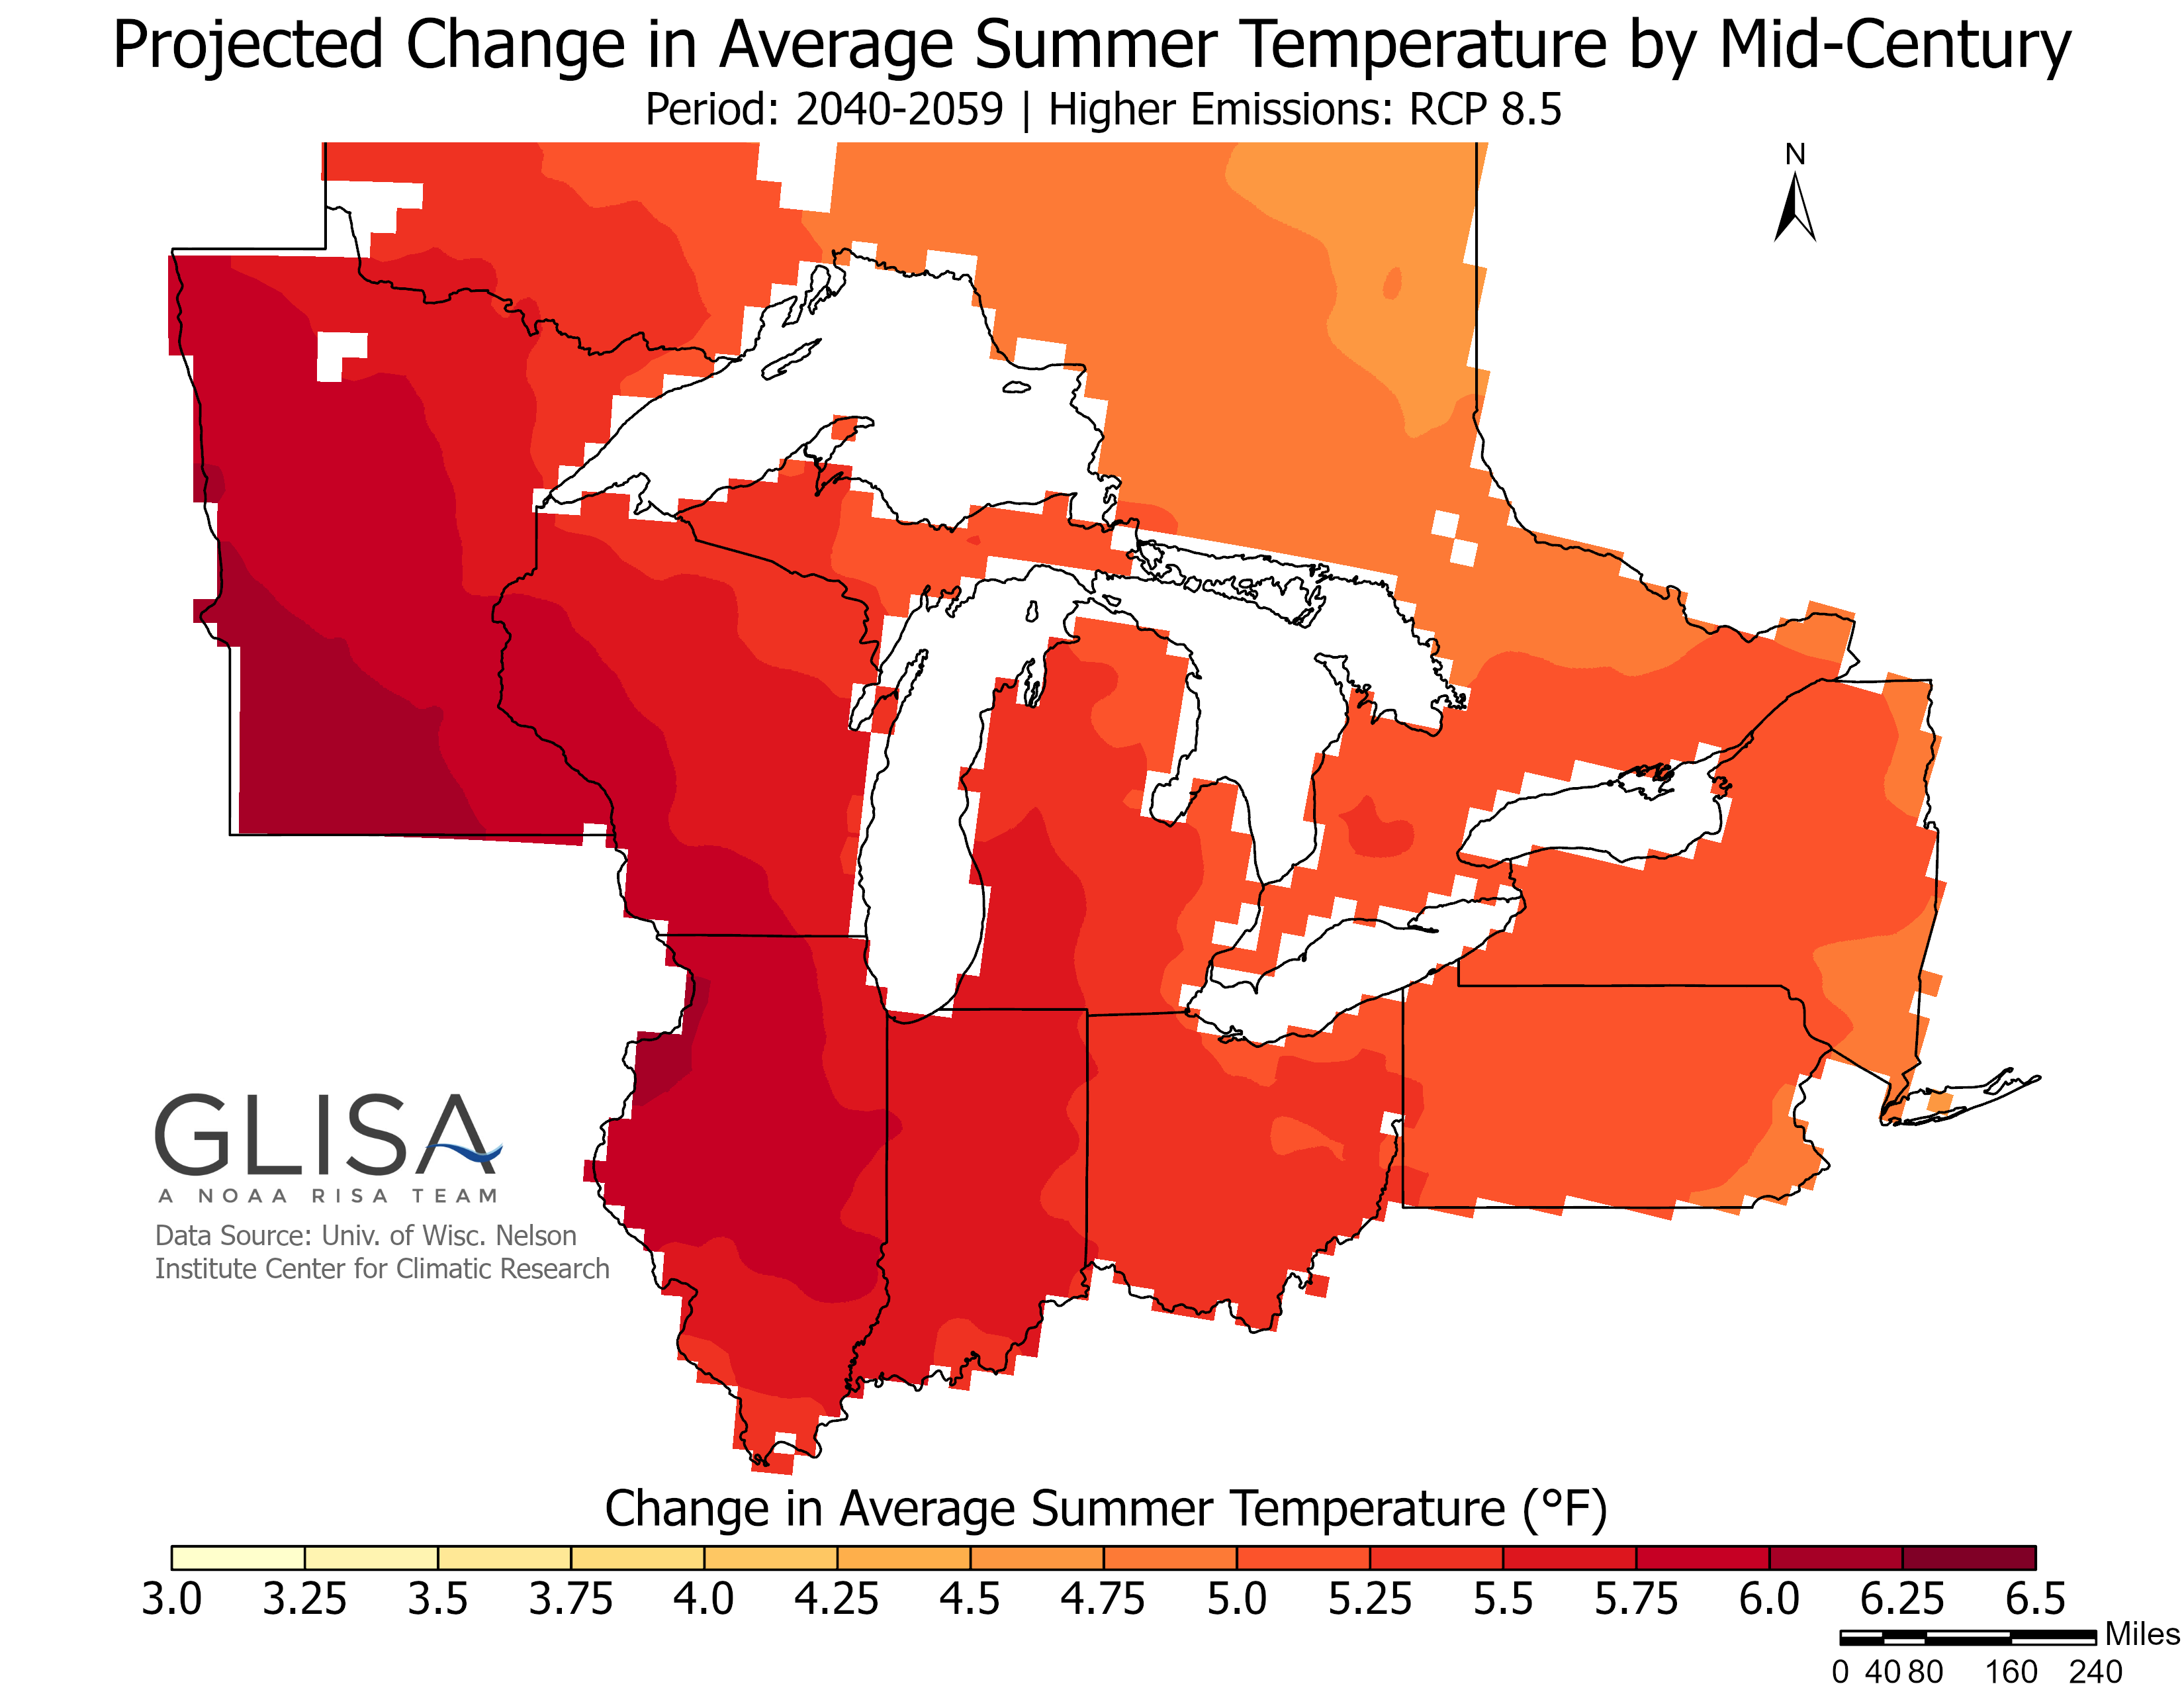
- By mid-century (2040-2059), summer is projected to be the season with the highest increase in temperature under a higher emission scenario (RCP 8.5; Figure 5 and 7)7.
| Table 1: Mean projected changes in days above/below temperature extremes. Projected changes are based on the RCP 8.5 scenario. Projected values are compared against 1979-2005 averages to calculate change. | |||||
|---|---|---|---|---|---|
| Projected Change, Number of Days (2040-2059) | |||||
| State | Daily low ≤ 0°F (-18°C) |
Daily low ≤ 32°F (0°C) |
Daily low ≥ 80°F (27°C) |
Daily high ≥ 86°F (30°C) |
Daily high ≥ 95°F (35°C) |
| Illinois | -3.1 | -36.7 | +5.3 | +84.3 | +26.4 |
| Indiana | -2.5 | -36.7 | +3.0 | +89.8 | +20.6 |
| Iowa | -7.3 | -34.5 | +2.2 | +81.7 | +17.3 |
| Michigan | -7.1 | -43.7 | +0.3 | +72.2 | +6.8 |
| Minnesota | -14.5 | -32.8 | +0.4 | +68.4 | +8.5 |
| Missouri | -2.0 | -32.0 | +6.1 | +82.5 | +32.9 |
| Ohio | -2.1 | -37.4 | +1.0 | +92.1 | +14.0 |
| Wisconsin | -11.0 | -37.2 | +0.4 | +73.4 | +7.1 |
Precipitation
Observed (1979-2021):
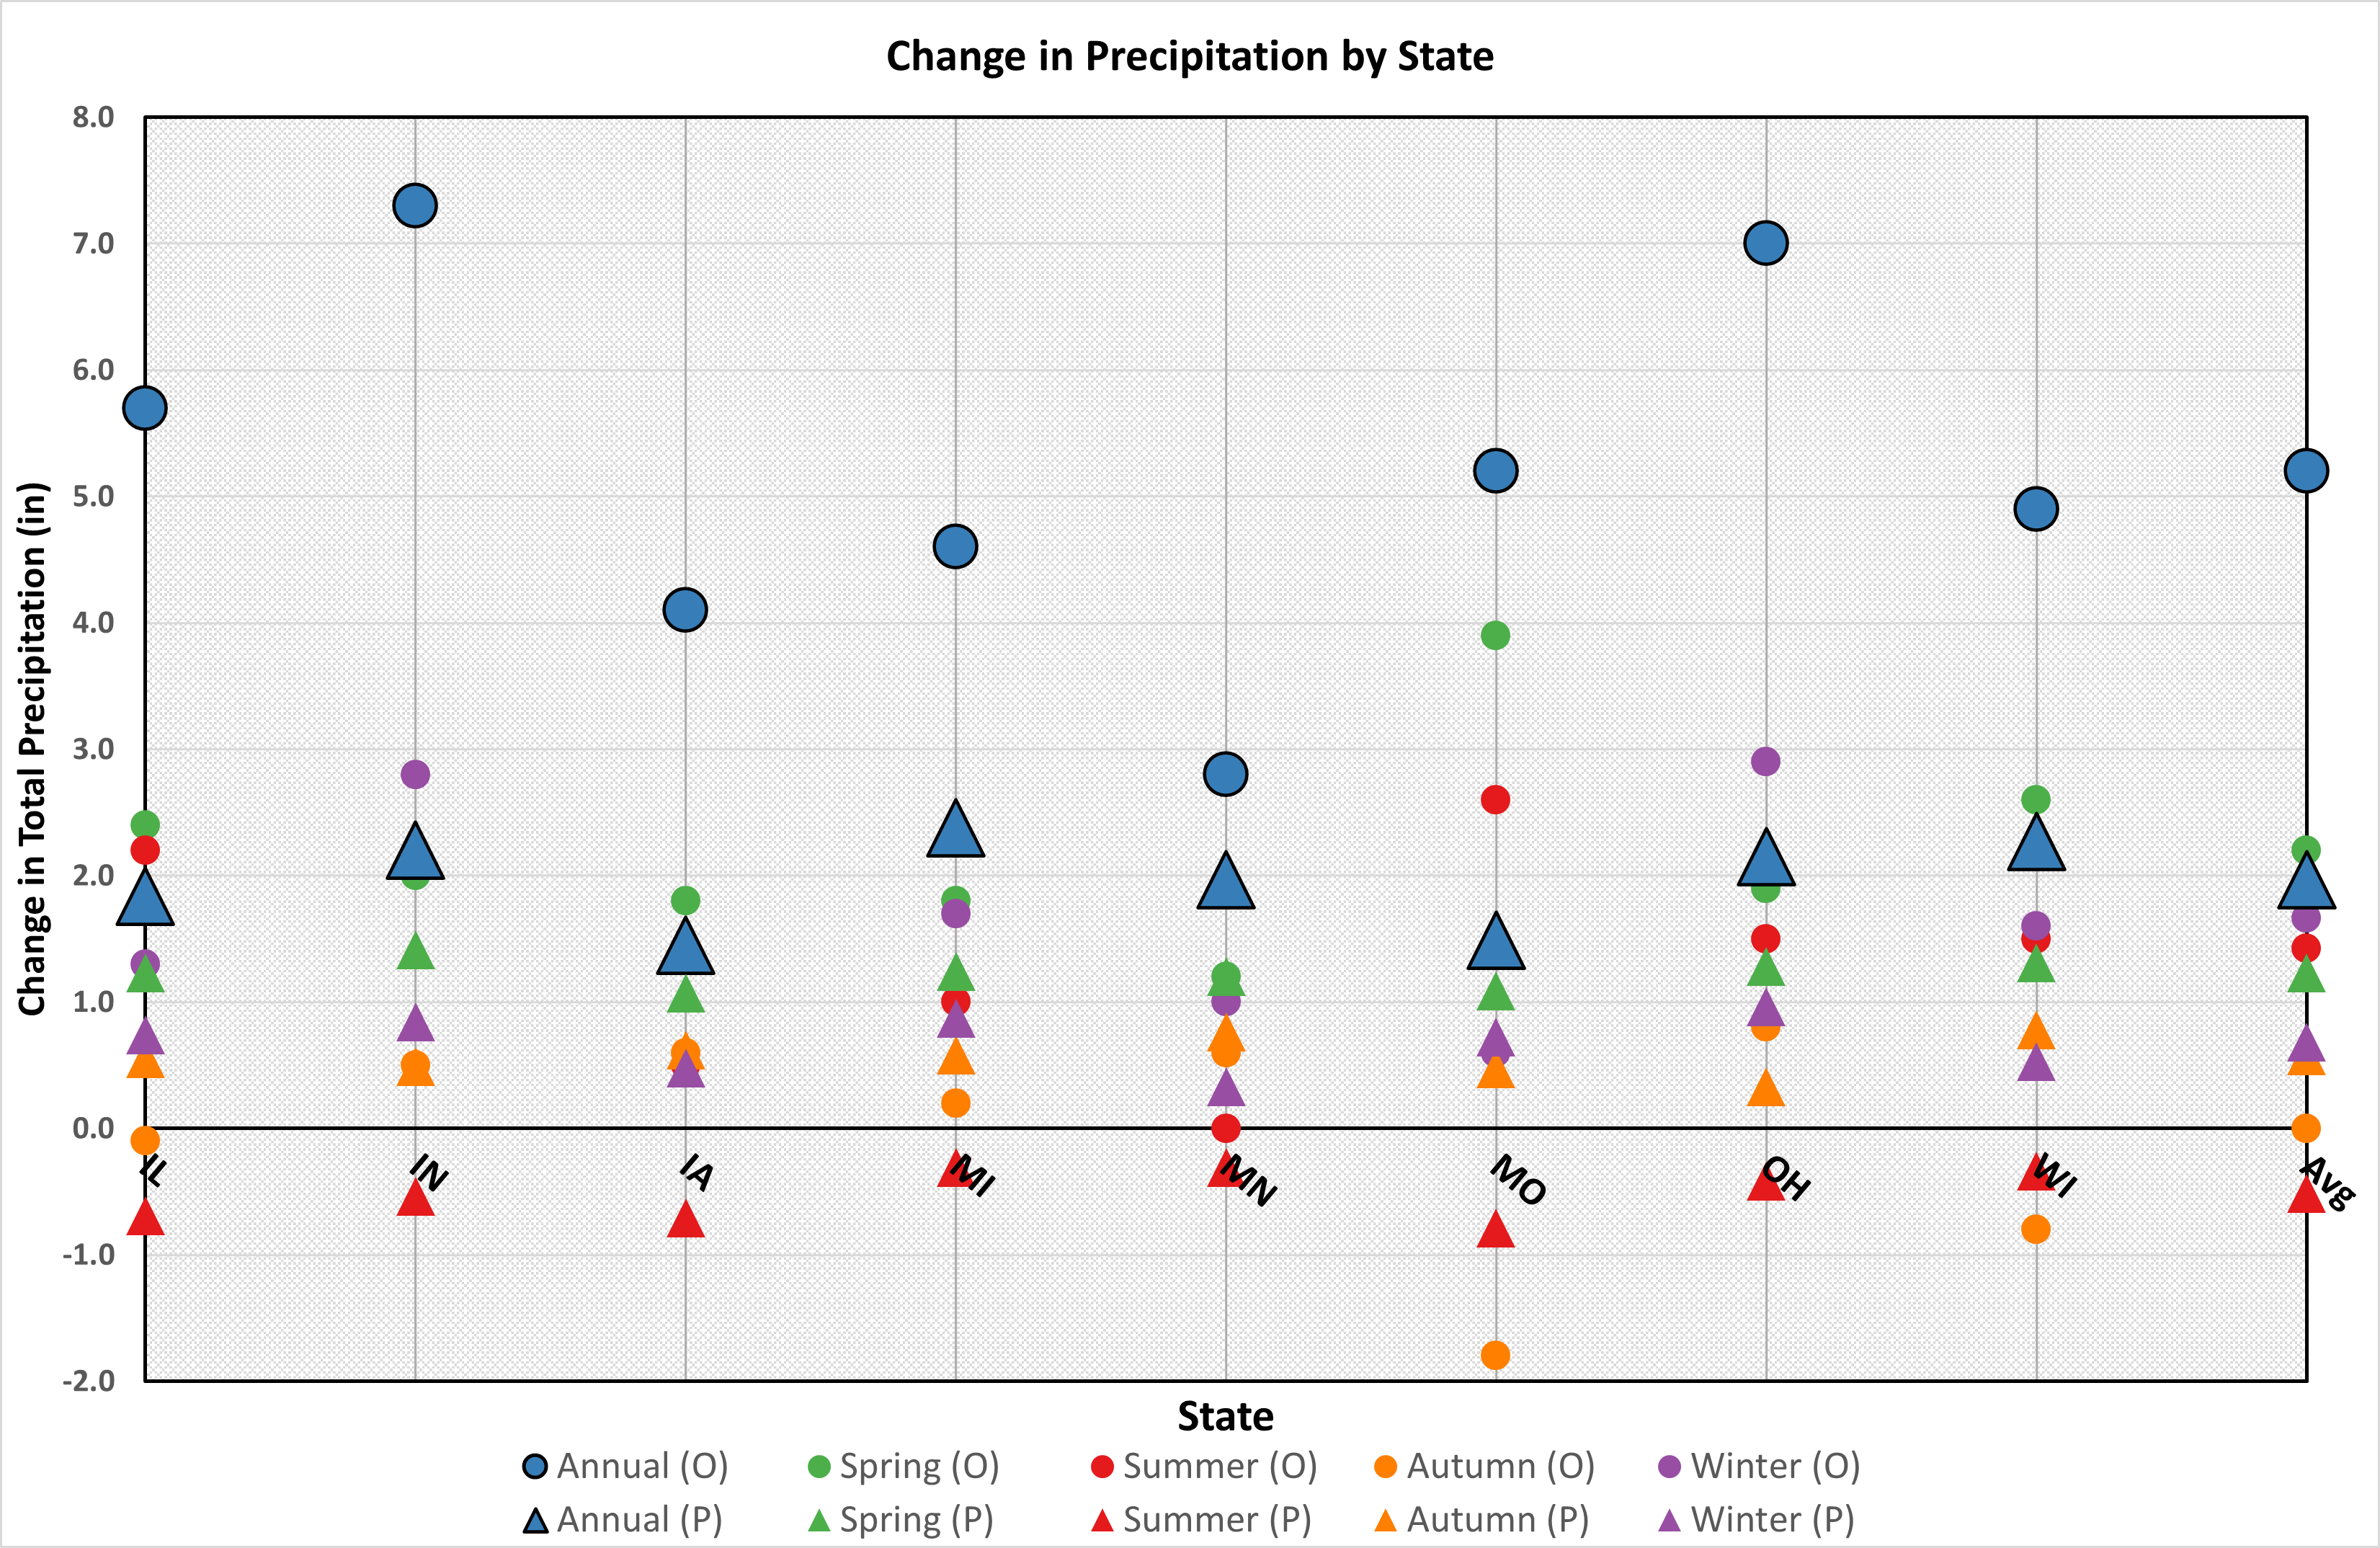
- Annual precipitation totals increased across all seasons in the Midwestern region, ranging from +2.8” in Minnesota to +7.0” in Ohio (Figure 8).
- Winter and spring seasons have the highest increase in total precipitation (Figure 8).
- Days with extreme precipitation (≥2”) increased by approximately 1 day per year.
Projected:
- Annual precipitation is projected to increase by an additional 1 to 3 inches by mid-century (Figure 8).
- Spring is the season with the highest projected increase in total precipitation, with the decrease projected to happen during summer months.
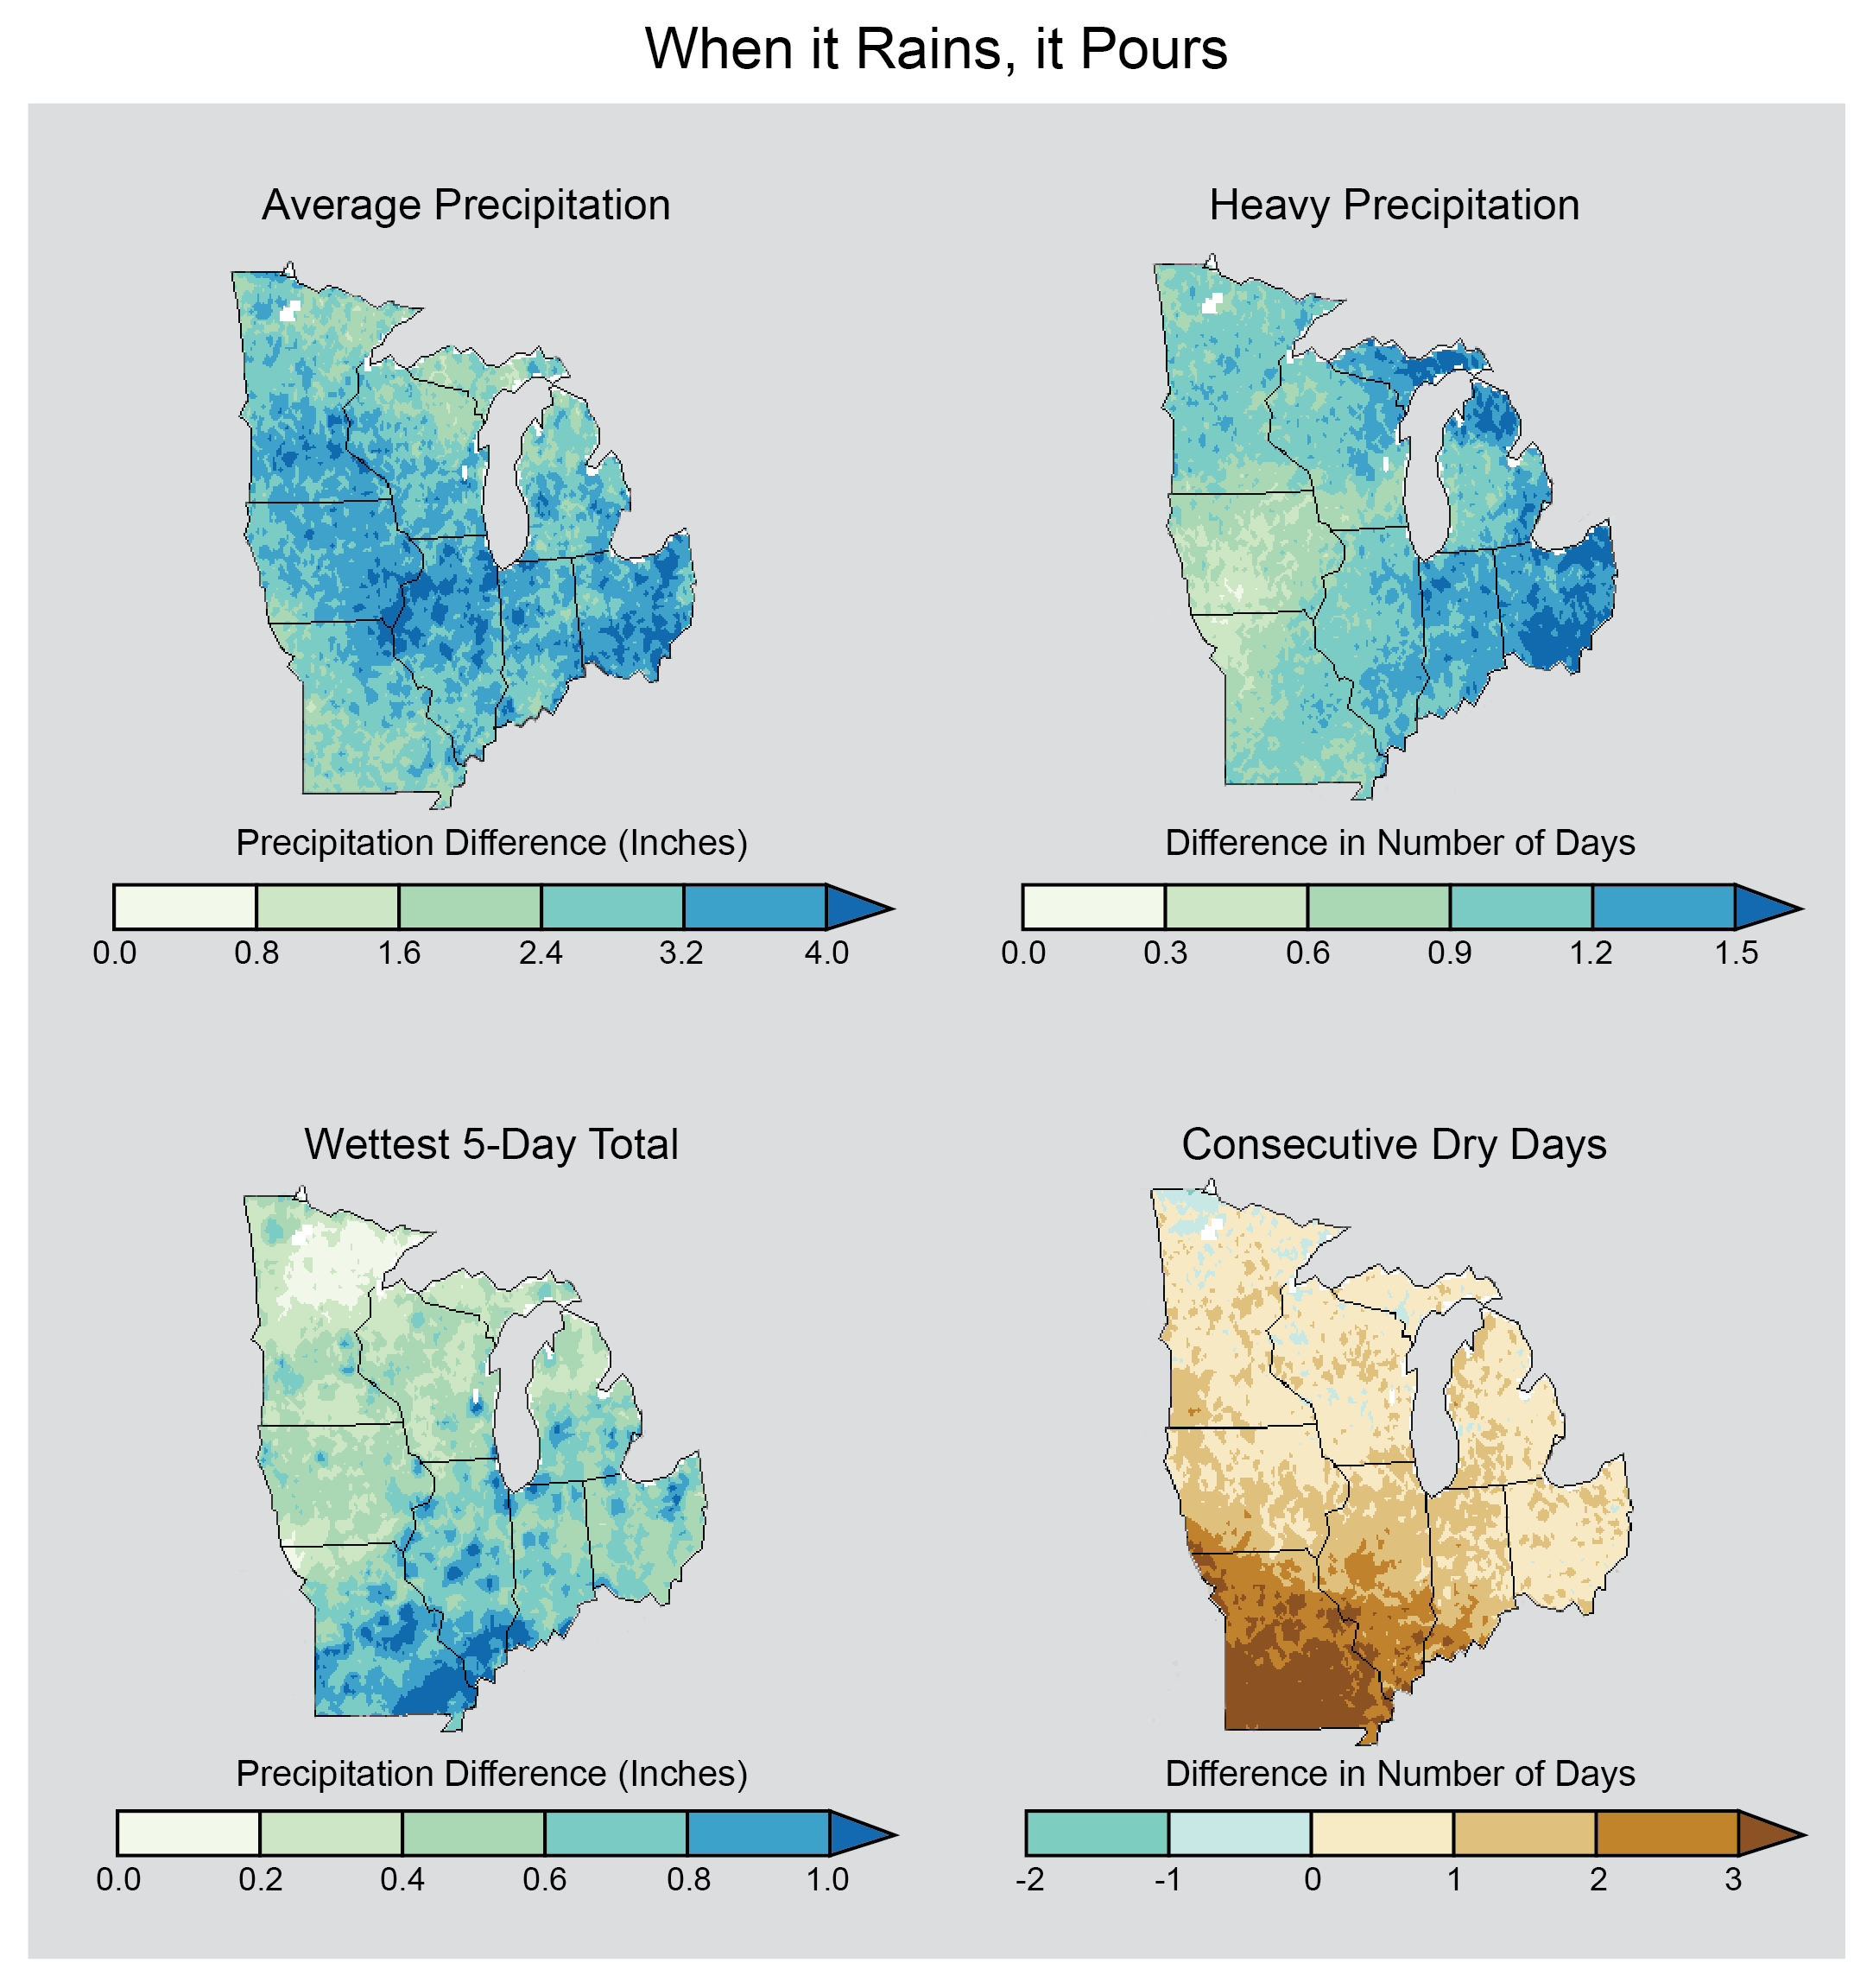
- Precipitation levels have become more variable8; this trend is projected to continue (Figure 9). Projections indicate an increase in both the number of heavy precipitation events and consecutive dry days9.
- Different soil textures will be more prone to erosion from heavy rainfall events, dry out more rapidly during a dry period, or retain excess moisture after heavy precipitation.
Impacts & Management Strategies
The observed and projected changes in Midwestern climate will impact Christmas tree production in meaningful ways. The following sections cover specific potential climate-related impacts to Christmas trees and management strategies to adapt to the change and mitigate the effects of the impacts.
Insect Pests & Pathogens
Winter temperatures will be milder with less extreme low temperatures. Spring weather will be warmer with greater precipitation.
Problem: Less cold temperature-induced pest mortality
A loss of extreme cold weather will likely increase the abundance of insects that overwinter in exposed locations. As an example, Cooley Spruce Gall adelgid was observed to have greater populations after winters with mild temperatures, compared to winters with extremely low temperatures10. Expect similar trends with other pest populations due to the loss of extreme cold temperature events.
Problem: Increase in pest reproduction
Warmer weather and longer growing seasons may increase the number of pest generations per year. Pine needle scale completes two generations annually throughout most of Michigan. However, in warmer than average years, a third generation of this pest has been observed. Under a warmer climate, pests may complete additional generations, which would increase population levels and extend the need for grower monitoring and control.
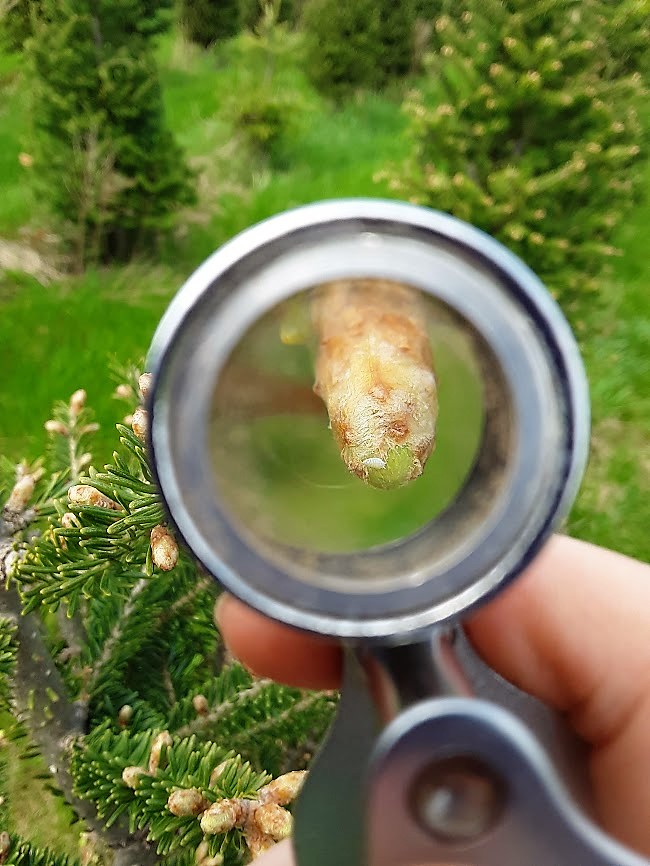
Warmer weather may also make pest populations more prolific. Balsam twig aphid is a major insect pest affecting true firs (Figure 10). In an experimental study, the number of Balsam twig aphids per shoot increased dramatically when shoots were held at elevated temperatures11. It is not clear whether the development of insect predators and parasitoids populations will parallel that of their prey and host insects.
Problem: Increase in diseases in warmer, wetter springs
For fungal diseases to develop, both a pathogen and a susceptible host must be present, and there must be a sufficient length of time to allow for germination of spores and infection of host tissues. Ambient temperature also is impactful, as less time is required for disease progression in warmer temperatures than under cooler conditions. Most needle cast pathogens infect newly emerging needles in the spring. With a wetter and warmer climate, increased needle cast disease pressure would be expected. For example, Swiss needle cast is a significant needle cast disease effecting Douglas fir causing chlorotic needles and premature needle defoliation12. The presence of infected needles also significantly reduces the postharvest quality of trees13. Researchers observed that warmer winters and wetter springs increased the severity of Swiss needle cast disease12.
The increased risk of disease due to warmer and wetter springs is not limited to needle cast diseases. Phytophthora root rot limits where Fraser fir and other highly susceptible species of Christmas trees can be grown. Phytophthora species are water molds and increased precipitation will likely increase the ability of Phytophthora’s swimming spores to infect roots14. In addition, the rate of disease development is affected by temperature – warmer ambient and soil temperature favor disease development14. Moreover, increased soil temperatures may shift Phytophthora populations toward more aggressive warm-weather species like P. cinnamomi, which have not historically been detected in Upper Midwest production regions.
Solutions:
To manage greater pest and disease pressure, growers will need to implement integrated pest management strategies.
- Regularly scout fields to monitor pest and disease presence.
- Ensure excellent coverage and proper timing of applications when pesticide applications are warranted.
- Plant tree species with later budbreak to avoid early season pests. In research trials, Balsam fir trees with later budbreak had less Balsam twig aphid damage than those trees that had early budbreak15.
- When possible, plant tree species that are more resistant to common diseases and pests.
Growers can also consider:
- Planting only healthy seedlings.
- Avoiding planting Phytophthora-susceptible tree species in sites with poorly drained soils.
- Improving drainage (surface, sub-surface) to remove excess moisture from a field.
- Culling highly susceptible and infested trees.
- Improving air flow to decrease drying time of moisture on tree needles (less dense tree spacing, enhanced weed control, basal pruning).
Warmer & Drier Summer Growing Season
The projected future climate during the summer growing season in the Midwestern region will include longer growing seasons with higher summer temperatures and decreased precipitation. This will impact Christmas tree farms in meaningful ways:
Young Seedlings
Problem: Increased frequency and intensity of drought
Recently planted Christmas trees are sensitive to drought stress. Young trees have a small, poorly developed root system, which can only access a portion of the soil profile that established trees can. During periods of little or no rainfall, available soil moisture may decrease to a level causing tree injury or death. During serve droughts widespread tree mortality can be common. As the frequency and intensity of droughts increase, the rates of transplant mortality are likely to increase.
Problem: Increased ambient temperatures
The majority of tree species grown for Christmas trees are native to high elevation environments that have moderate summer temperatures. As an example, Fraser fir grows native in the southern Appalachian Mountains at elevations of 4,900 feet with summer temperatures rarely exceeding 72°F16. Higher temperatures can cause tree stress by increasing respiration rates and evapotranspiration demands. If trees are unable to meet those requirements, observations of limited growth, tree injury (browning needles), or tree mortality can occur. Recently planted trees with a small, limited root system are most at risk of high temperature related stress.
Solutions:
- Avoid planting seedlings in drought-prone sites.
- Manage weeds before and after planting. Successful weed management is critical to reduce competition for soil moisture during the establishment phase of tree production. Uncontrolled weeds reduced tree growth and survivability17.
- Plant seedlings with a larger root-to-shoot ratio, which are more tolerant of drought stress. Stock types play a key role in seedling survival, particularly on droughty sites.
- Add irrigation. Irrigation can improve young tree growth, establishment, and survivability, especially during droughts17.
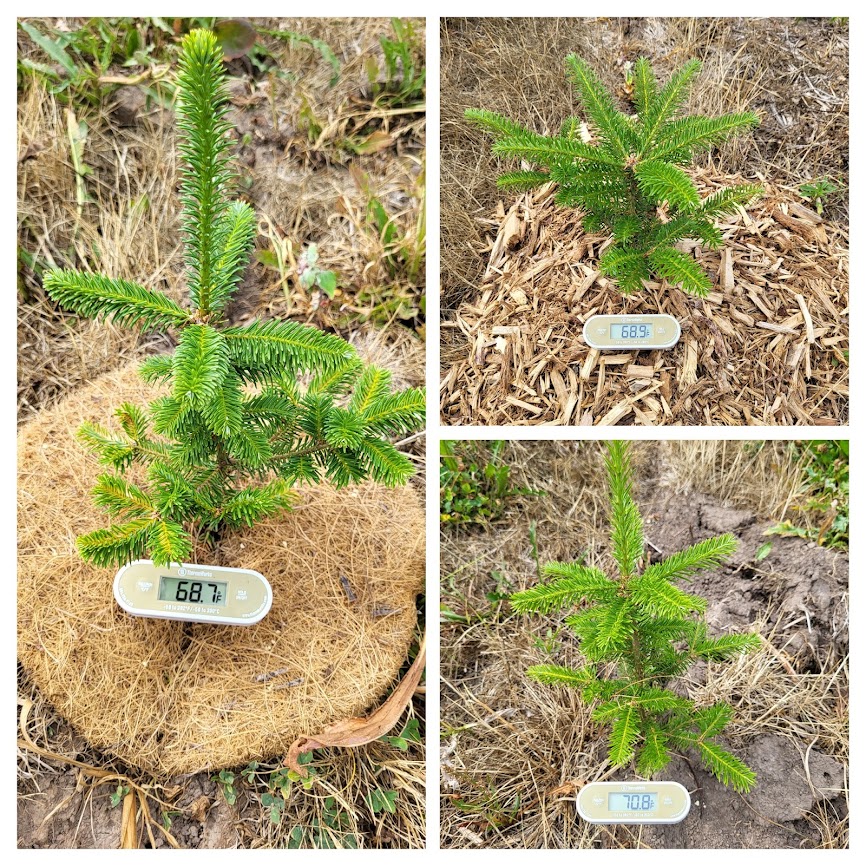
- Add mulch around the base of newly planted trees. Mulch produces similar increases in tree growth and survivability to that of irrigation, with either resulting in greater establishment than nontreated trees17. Mulch moderates soil temperatures and increases soil moisture (Figure 11)18.
- Install shade screens around transplants. Shade screens have increased tree transplant survivability19,20. Shade screens limit high temperatures and overall water demand20.
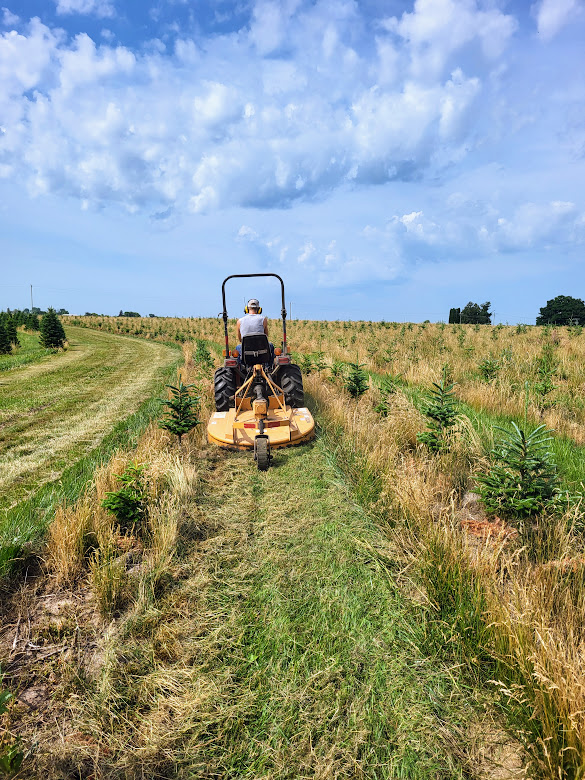
- Keep row middles vegetated (Figure 12). Non-vegetated soil absorbs more heat and will have higher soil temperatures than vegetated row middles.
- Use tree breeding programs that select for heat and drought tolerant trees.
Established Trees
Problem: Increased frequency and intensity of drought and high ambient temperatures
While larger established trees are more deeply rooted and not as sensitive as newly planted seedlings to mild drought, severe drought coupled with high ambient temperature can have a number of direct and indirect effects on established trees. Direct damage is typically associated with desiccation of foliage. One of the first physiological responses of plants to drought stress is the closure of the stomates, which reduces photosynthesis and evapotranspiration cooling of the needles. This can increase the risk of direct heat damage to the needles. Severe drought stress also predisposes tree species to attack by a number of pests and diseases21,22. By altering the trees physiology, stressed trees may be more attractive to insects and susceptible to diseases. Tissues that are directly damaged by the stress are also easily invaded by otherwise “weak” pathogens. Specific examples of insects and diseases that are more aggressive on stressed trees, include bark beetles, Armillaria root disease, Phomopsis twig blight and canker, and Diplodia tip blight.
Solutions:
- Avoid planting seedlings in drought-prone sites.
- Prepare sites prior to planting to decrease competition for moisture.
- Irrigate trees on droughty sites.
Warmer Sales Season
The projected future climate in the Midwestern region will include falls that are warmer and wetter than previously experienced.
Problem: Needle retention
A potential challenge to the Christmas tree industry may result from increased fall temperatures. Exposure to cold temperatures is linked to a critical attribute for Christmas trees: needle retention, also known as needle set. The ability of trees to hold needles is a complex process but is impacted by trees gaining winter hardiness through environmental cues. The precise threshold and duration of low temperature needed to induce needle set is not well defined and likely differs between tree species. However, general observations are that trees harvested later (with more cold exposure) will have greater needle retention than those harvested earlier in the season. In experimental trials, Fraser fir branches harvested in late November exhibited greater needle retention than those harvested in early October23. Warm temperatures during harvest will also increase the potential loss of moisture from harvested trees, which also triggers needle loss23. Excellent needle retention is paramount to consumers, and if lacking, may reduce demand for real trees24.
Solutions:
No single mitigation technique is likely to completely resolve needle retention issues created by a lack of cold accumulation prior to harvest and the loss of moisture after harvest. Growers may consider:
- Planting seedlings with superior needle retention grown from seed orchards.
- Making changes to postharvest tree handling and storage environments to keep trees as cool as possible and minimize postharvest moisture loss from trees (refrigerated, controlled atmosphere)25.
- Delaying harvest dates25.
- Using data loggers to monitor levels of cold accumulation to help guide the harvesting of trees. Because of cold air drainage patterns, cold acclimation is site dependent. Even when sites are close to each other, trees in a low area will generally be exposed to more cold than trees on nearby slopes on hills.
- Altering order in which tree species are harvested: harvesting species that require less cold exposure first (Scots pine) followed by more sensitive species later (concolor fir).
- Working with retailers to maintain the freshness of trees on retail lots (multiple shipments, protection of trees from wind and sun, the use of micro-misters to minimize moisture loss from displayed trees, and other means)
- Providing consumers with information on the keepability of different tree species and how to properly care for displayed trees.
- Incorporating needle-loss testing in breeding programs to identify trees with needle retention even with minimal preharvest cold acclimation.
Problem: Soil erosion and compaction
Wet soils are prone to degradation from erosion and compaction. Soil erosion occurs as saturated soil particles detach from the soil surface and move off site. This leads to the loss of topsoil, organic matter, and soil structure. The potential for soil compaction also increases in wet conditions as soils lose internal cohesion and decrease their ability to resist compression forces27. Compaction occurs as a force, usually equipment, pushes soil particles closer together into a dense mass27. Compaction results in the loss of soil structure, pore space, and gas exchange capability. In severe soil compaction a physical barrier may be created that tree roots cannot grow through. Both processes result in a feedback loop. As erosion and compaction occur, soil structure is degraded, pore space is lost, and less water can infiltrate the soil. This results in more erosion and soil compaction occurring. Soil compaction also increases the severity of drought stress, which can predispose trees to increased damage by pests and pathogens. Reduced rates of water infiltration also increase the frequency of soil saturation, which increases the risk of Phytophthora root rot. Both soil erosion and compaction decrease soil productivity and create an environment that is less supportive of the production of healthy trees production.
Solutions:
There are several ways to mitigate soil erosion and compaction issues.
- Add additional drainage (surface, sub-surface) to remove excess moisture from a field.
- Maintain a vegetated row middle, which can lessen erosion and compaction problems (Figure 12). Erosion and compaction are increased over nonvegetated ground.
- Eliminate or reduce equipment movement during wet periods. Compaction problems increase when equipment passes over saturated soils. If movement is required, implement flow patterns to minimize travel alleys and concentrate traffic into designated pathways. The majority of soil compaction occurs on the first pass.
- Implement practices that will build up soil organic matter. Organic matter is a component of soil aggregates, and aggregation leads to improved soil structure and increased pore space. These physical properties will decrease compaction and erosion in a wetter environment. Such practices include:
- Additions of cover crops, compost, wood chips, and other organic material, which can increase soil organic content over time.
- Elimination or reduction in practices that lead to organic matter degradation (tillage vs. no-till plantings, preventing erosion).
State Agriculture-Climate Assessments
For more information on observed and projected climate data in your state as well as how these changes are expected to impact agriculture, read your state’s Climate Change Impacts on [State] Agriculture bulletin. View or download a copy at https://www.climatehubs.usda.gov/hubs/midwest/topic/assessing-impacts-climate-change-midwest-agriculture.
Feedback survey
Please take our brief feedback survey. This feedback is intended to provide guidance to the Midwest Climate Hub and its partners on the climate-related resource needs of the Christmas tree farming community.
References
- United States Department of Agriculture, National Agricultural Statistics Service. (2022). Quick Stats. https://quickstats.nass.usda.gov/.
- Baule, (2022). Dataset description and methods for historical and projected climate data for ag state summaries. https://www.climatehubs.usda.gov/sites/default/files/Methods%20for%20Historical%20and%20Projected%20Climate%20Data%20for%20Ag%20State%20Summaries_20220809.pdf
- Meinshausen, M., Smith, S. J., Calvin, K., Daniel, J. S., Kainuma, M. L. T., Lamarque, J., Matsumoto, K., Montzka, S. A., Raper, C. B., Riahi, K., Thomson, A., Velders, G. J. M., & van Vuuren, D. P. P. (2011). The RCP greenhouse gas concentrations and their extensions from 1765 to 2300. Climatic Change, 109(1), 213–241. https://doi.org/10.1007/S10584-011-0156-z
- Midwestern Regional Climate Center (MRCC). (n.d.) Freeze date tool. https://mrcc.purdue.edu/freeze/freezedatetool.html.
- Ford, T. (n.d.). Analysis of changing winter chill hours in the Midwest [in review]. USA.
- NOAA Regional Climate Centers. (n.d.). Applied Climate Information System (ACIS). http://scacis.rcc-acis.org/.
- Great Lakes Integrated Sciences and Assessments (GLISA). (n.d.).Great Lakes regional climate change maps. https://glisa.umich.edu/great-lakes-regional-climate-change-maps/.
- Ford, T. W., Chen, L., & Schoof, J. T. (2021). Variability and transitions in precipitation extremes in the Midwest United States. Journal of Hydrometeorology, 22(3), 533–545. https://doi.org/10.1175/JHM-D-20-0216.1.
- Pryor, S. C., Scavia, D., Downer, C., Gaden, M., Iverson, L., Nordstrom, R., Patz, J., & Robertson, G. P. (2014). Midwest. Climate change impacts in the United States: The third national climate assessment. In J. M. Melillo, T.C. Richmond, & G. W. Yohe (Eds.), S. global change research program (418-440). doi.org/10.7930/J0J1012N.
- Cranshaw, W. S. (1989). Patterns of gall formation by the Cooley spruce gall adelgid on Colorado blue spruce. Journal of Arboriculture, 15(11), 277-280.
- Doherty, J. F., Guay, J. F., & Cloutier, C. (2017). Temperature-manipulated dynamics and phenology of Mindarus abietinus (Hemiptera: Aphididae) in commercial Christmas tree plantations in Québec, Canada. The Canadian Entomologist, 149(6), 801-812.
- Stone, J. K., Coop, L. B., & Manter, D. K. (2008). Predicting effects of climate change on Swiss needle cast disease severity in Pacific Northwest forests. Canadian Journal of Plant Pathology, 30(2), 169-176.
- Chastagner, G. A., Byther, R. S., MacDonald, J. D., & Michaels, E. (1984). Impact of Swiss needle cast on postharvest hydration and needle retention on Douglas-fir Christmas trees. Plant disease, 68(3), 192-195.
- McKeever, K. M., & Chastagner, G. A. (2019). Interactions between root rotting Phytophthora, Abies Christmas trees, and environment. Plant disease, 103(3), 538-545.
- Fondren, K. M., & McCullough, D. G. (2003). Phenology and density of balsam twig aphid, Mindarus abietinus Koch (Homoptera: Aphididae) in relation to bud break, shoot damage, and value of fir Christmas trees. Journal of Economic Entomology, 96(6), 1760-1769.
- Cory, S. T., Wood, L. K., & Neufeld, H. S. (2017). Phenology and growth responses of Fraser fir (Abies fraseri) Christmas trees along an elevation gradient, southern Appalachian Mountains, USA. Agricultural and Forest Meteorology, 243, 25-32.
- Cregg, B. M., Nzokou, P., & Goldy, R. (2009). Growth and physiology of newly planted Fraser fir (Abies fraseri) and Colorado blue spruce (Picea pungens) Christmas trees in response to mulch and irrigation. HortScience, 44(3), 660-665.
- Chalker-Scott, L. (2007). Impact of mulches on landscape plants and the environment: A review. Journal of Environmental Horticulture, 25(4), 239-249.
- Petersen, G. J. (1982). The effects of artificial shade on seedling survival on Western Cascade harsh sites. Tree Planters’ Notes. 33(1), 20-23.
- Landgren, C., Kowalski, J., & Cregg, B. (2021). Can treatments at planting improve noble fir seedling survival? Tree Planters’ Notes 64(1), 32-38.
- Omdal, D., Shaw, C. G. III, & Chastagner, G. (2018). Armillaria root disease. In E. M. Hansen, K. J. Lewis, & G.A. Chastagner (Eds.), Compendium of conifer diseases. (Rev. 2nd, pp. 35-38). APS Press.
- Chastagner, G.,& Talgø, V. (2018). Diseases of conifers grown as Christmas trees. In E. M. Hansen, K. J. Lewis, & G.A. Chastagner (Eds.), Compendium of conifer diseases. (Rev. 2nd, pp. 158-162). APS Press.
- Mitcham-Butler, E. J., Hinesley, L. E., & Pharr, D. M. (1988). Effects of harvest date, storage temperature, and moisture status on postharvest needle retention of Fraser fir. Journal of Environmental Horticulture, 6(1), 1-4.
- MacDonald, M. T., Lada, R. R., & Veitch, R. S. (2014). Linking certain physical characteristics with postharvest needle abscission resistance in balsam fir. Journal of Applied Horticulture, 16(1), 29-31.
- Thiagarajan, A., MacDonald, M., & Lada, R. (2016). Environmental and hormonal physiology of postharvest needle abscission in Christmas trees. Critical Reviews in Plant Sciences, 35(1), 1-17.
- Hinesley, L. E., & Chastagner, G. A. (2016). Christmas tree keepability. In K. C. Gross, C. Y. Wang, & M. Saltveit (Eds.). The commercial storage of fruits, vegetables, and florist and nursery stocks. (Agriculture handbook 66, Feb. rev. ed., pp. 650-658.) USDA, Agricultural Research Service.
- Magdoff, F., & Van Es, H. (2021). Building soils for better crops (4th ed.). Sustainable Agriculture Research and Education.
This work was created in partnership with the USDA Midwest Climate Hub & Washington State University.


 Print
Print Email
Email


