
Lessons From Long Term Research: Comparing No-Till to Conventional Tillage Over 30 years
DOWNLOADJanuary 9, 2025 - Christine Charles, Elizabeth Schultheis, Brook Wilke, Tayler Ulbrich, Nameer Baker, Nick Haddad, and Phil Robertson.
Background
In 1988, the Kellogg Biological Station Long Term Ecological Research site (KBS LTER) joined the National Science Foundation’s LTER Network to study the ecology of field crop production. KBS LTER examines ecological and evolutionary interactions in field crops and natural systems, aiming to improve farm profitability and sustainability.
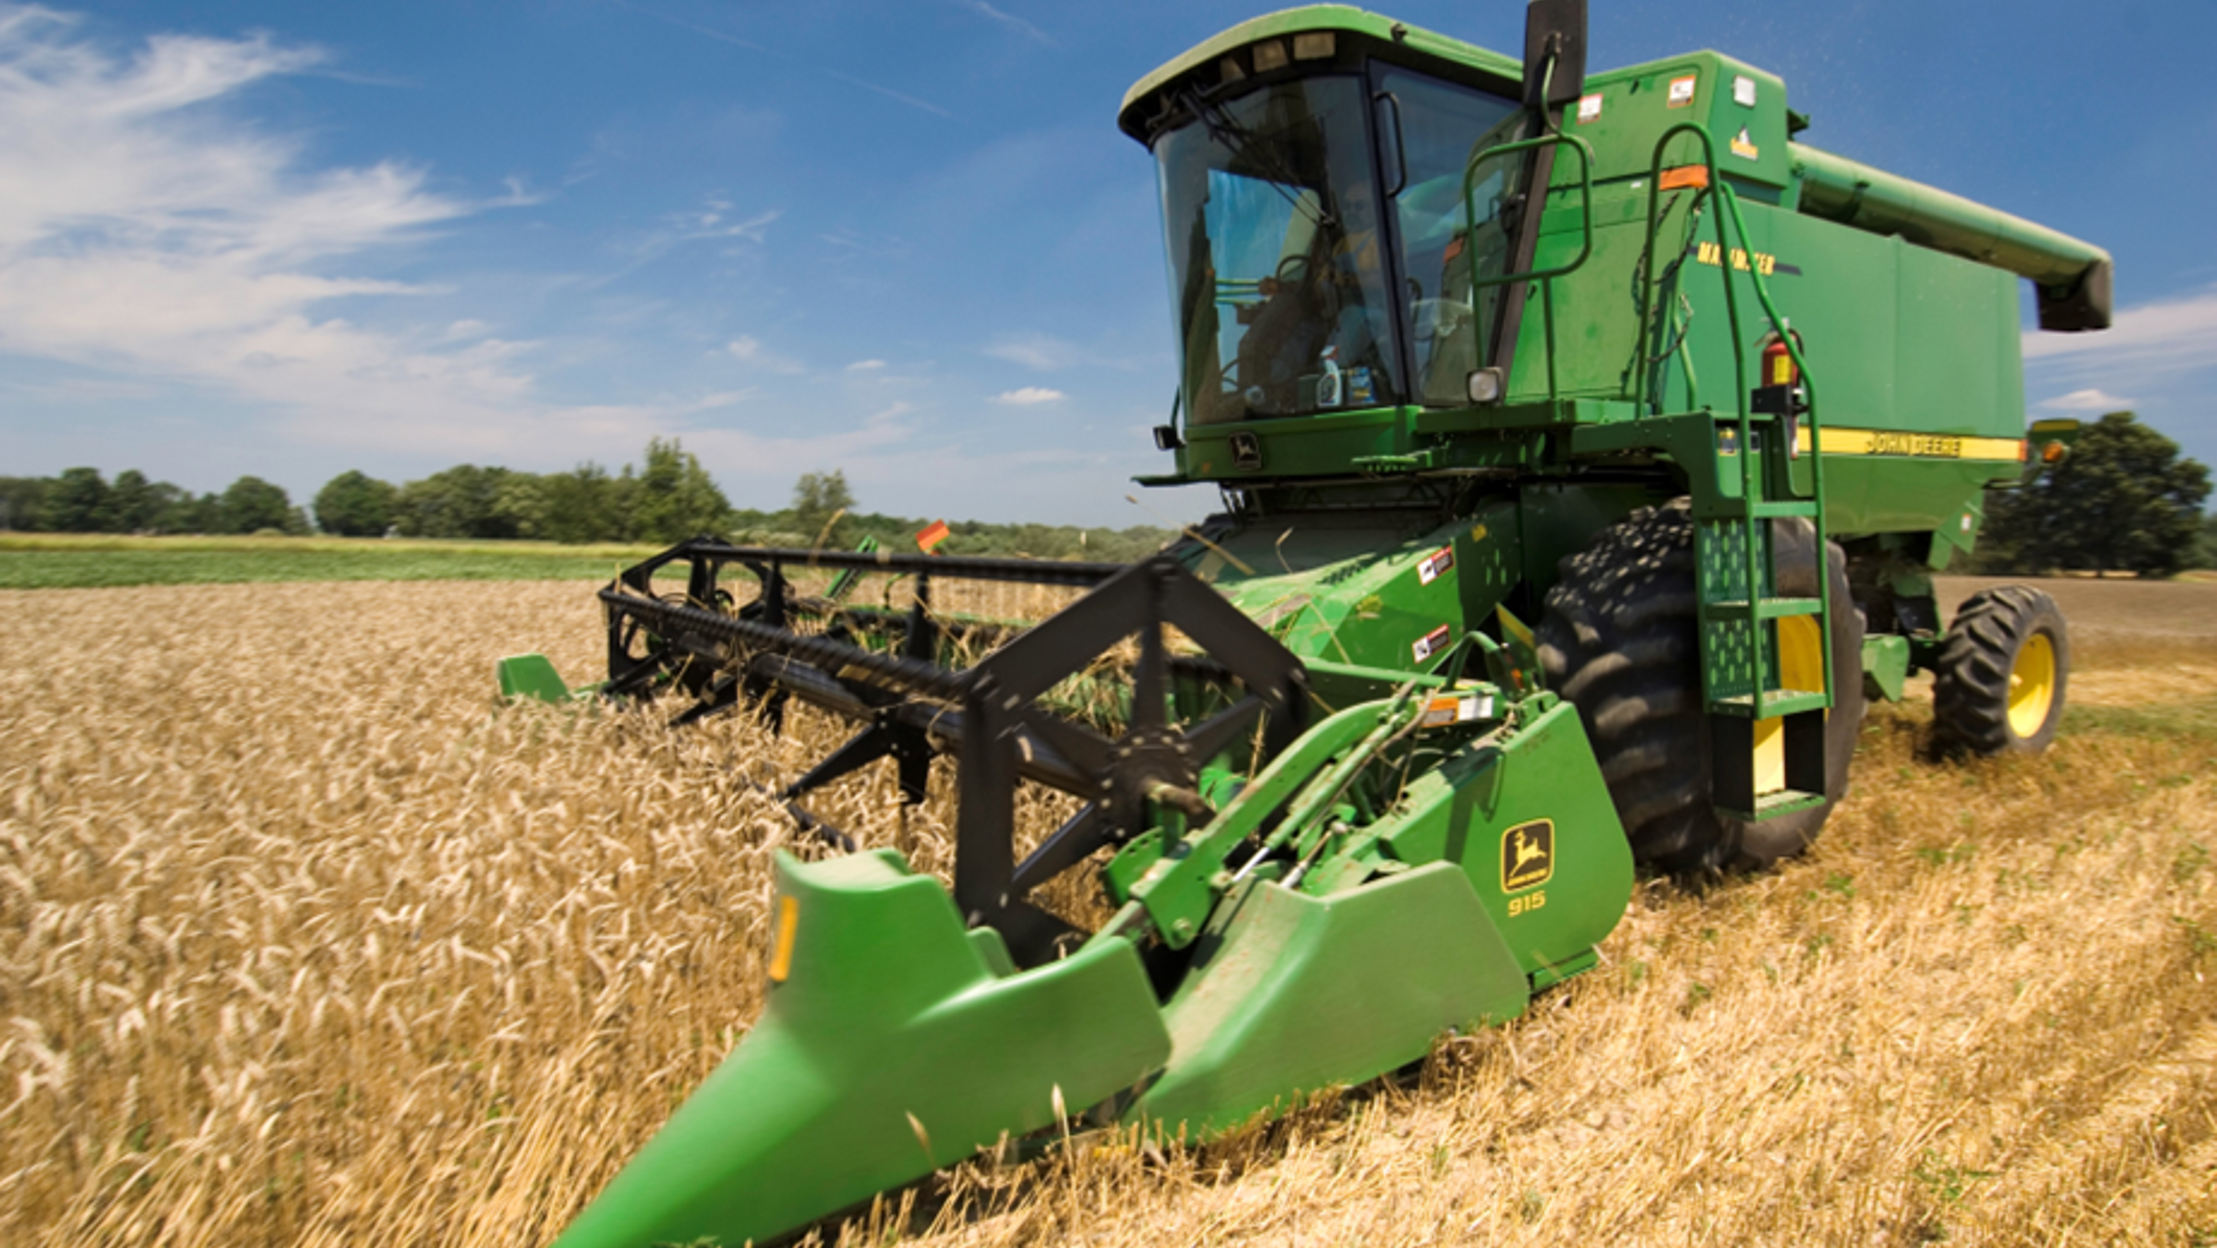
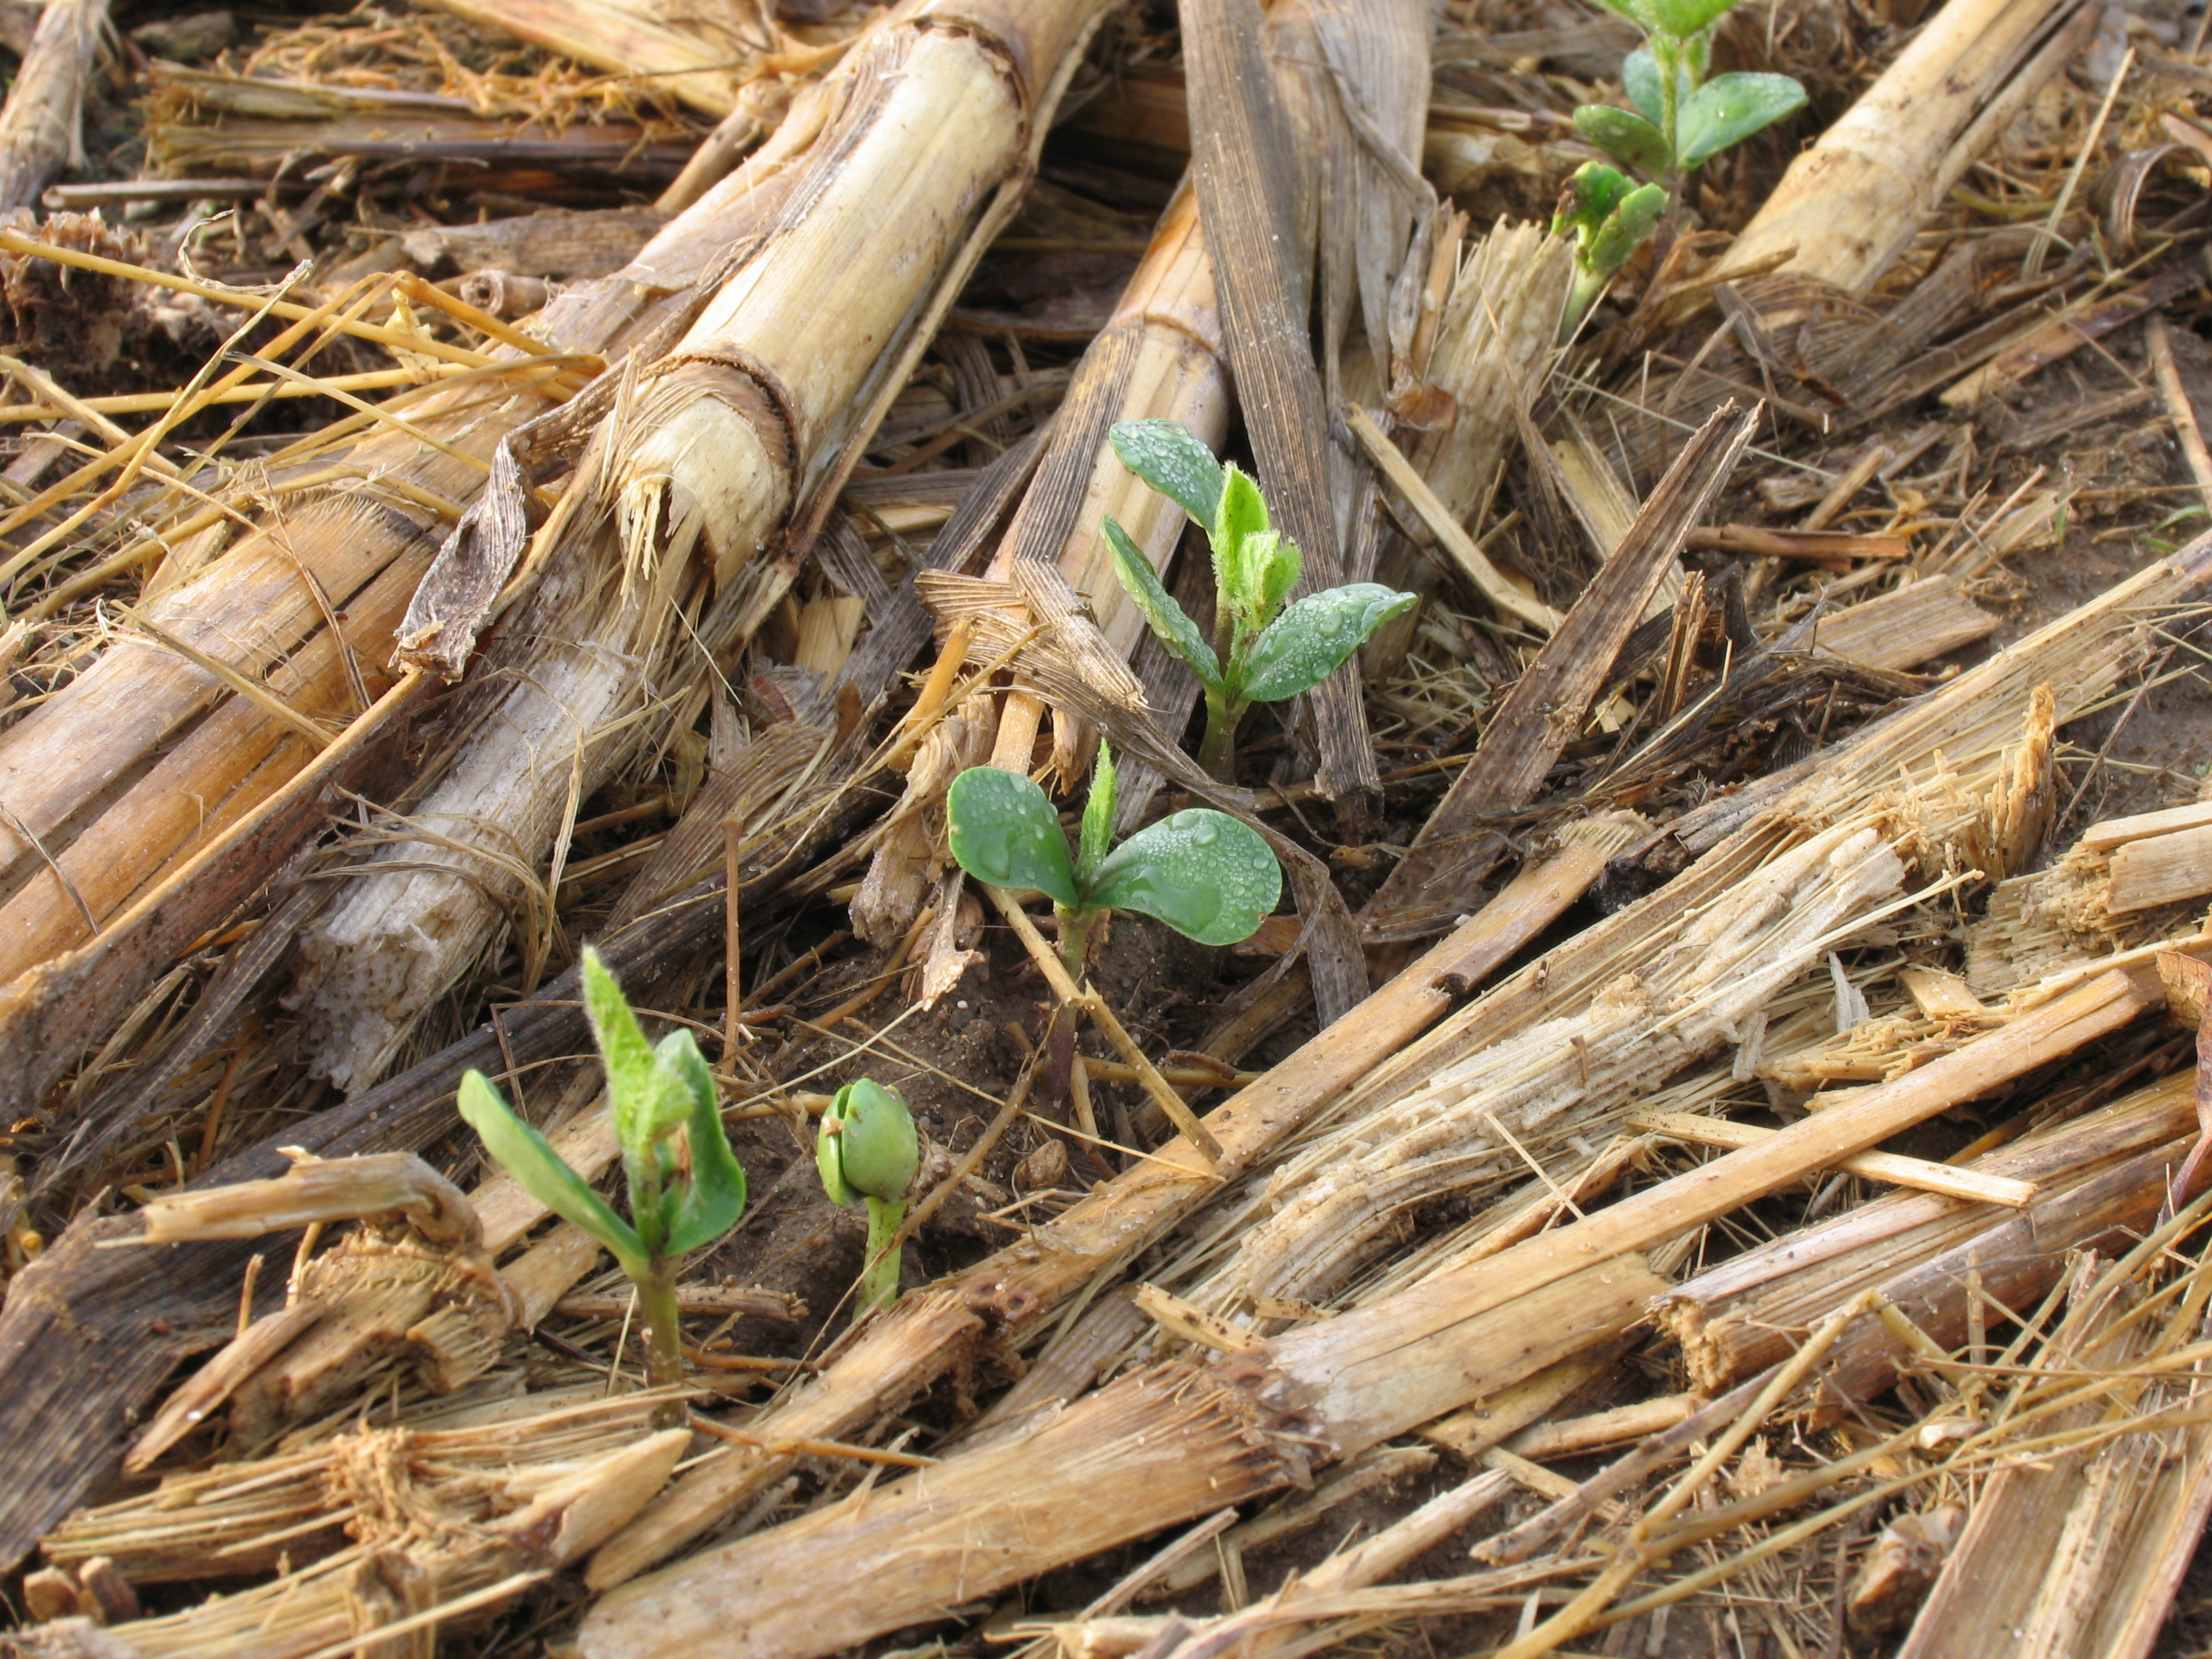
The main KBS LTER experiment features four corn/soy/wheat cropping systems with varying management practices, three perennial systems, and an unmanaged ecosystem. The cropping system trials include conventional management (tilled, follows MSU fertilizer and pesticide recommendations), no-till (follows MSU fertilizer and pesticide recommendations), reduced input (tilled, receives 1/3 of chemical inputs, and includes cover crops), and biologically based (tilled, receives no chemical inputs, includes cover crops) (Figure 1).
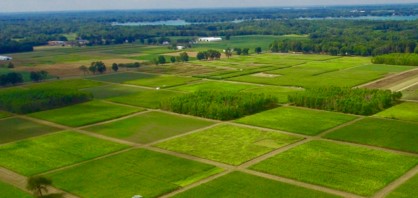

Descriptions of Tilled and No-Tilled Treatments in the KBS LTER |
|
|
Conventional Tillage Treatment |
No-Till Treatment |
|---|---|
|
|
Why No-Till?
Tillage prepares seedbeds, incorporates nutrients, prevents weed competition, and manages crop residue. However, tillage alters the soil's chemical, biological, and physical properties and can increase the risk of nutrient loss, erosion, and compaction while reducing soil organic matter and biological activity. Improved machinery, availability of herbicides, and decades of experience from no-till farmers have made no-till farming more feasible. Acreage dedicated to the practice varies largely by region and crop in the United States but the adoption of no-till has stagnated in many regions.1, 2
What Have We Learned From Over 30 Years Of Research In Tilled And No-Tilled Systems?
Significant questions remain about no-till's profitability, short-term and long-term field changes, effectiveness, and the learning curve of a new management system. These uncertainties can hinder adoption or lead people to stop the practice.3 Fortunately, long-term research on no-till systems at the KBS LTER offers valuable insights into the effects of this practice, which may help address some of the uncertainties surrounding no-till.
For over 30 years, the KBS LTER has measured yield, profitability, soil aggregation, carbon sequestration, greenhouse gas emissions, and soil moisture in both tilled and no-tilled fields. Here, we summarize the key findings and observations from this data. In the “Practice Consideration” section, we discuss tradeoffs and nuances in adoption, including how no-till can be included alongside other conservation farming practices to improve success.
HIGHLIGHTS: Continuous no-till fields at KBS have…
- Outyielded tilled systems, most consistently after 15 continuous years of the practice.6
- Helped crops become more resilient to weather extremes, such as drought and flooding, due to improved water holding capacity and improved soil drainage.10
- Become more profitable than tilled systems even after paying off the initial equipment investment.4
- Shown that soil organic matter gains can be readily lost with a single tillage event. When converting Conservation Reserve Program (CRP) land back to cropland after one tillage pass, carbon sequestration and soil aggregation gains that were made over several years were lost. This highlights a key difference between continuous and rotational no-till when it comes to carbon sequestration.12
- Accumulated compounded benefits that have been built over decades. 2 to 3 years were not long enough to consistently observe the benefits described above.5
Yield: How have corn, soy, and wheat yields compared between tilled and no-till systems?
For the first 15 years of research, no-till (NT) plots had comparable yields to the conventionally tilled (CT) plots at the KBS LTER site across all three crops (Table 1 and Figure 2). After 15 years, NT corn and soybeans started to regularly out-yield CT corn and soybeans. Compared to corn and wheat, soybean yields responded most quickly to the NT treatment, with a greater yield in NT than CT after 8 years.6
|
Yields (bu/A) |
Corn |
Soybean |
Wheat |
|||
|---|---|---|---|---|---|---|
|
CT |
NT |
CT |
NT |
CT |
NT |
|
|
1989-2004 |
93.4 |
96.6 |
33.4 |
36.7 |
52.2 |
49.7 |
|
2005-2023 |
134.1 |
160.4 |
42.1 |
49.0 |
63.9 |
67.1 |
|
Average |
115.9 |
132.8 |
37.8 |
43.1 |
60.4 |
62.5 |
Table 1: Yield averages of no-tilled (NT) and conventionally tilled (CT) corn, soybeans, and wheat in the first 15 years, the years, and entire experiment so far. Compiled by Christine Charles from KBS LTER data. 6
.jpeg?language_id=1)
Soil Moisture and Drainage: How do differences in tillage influence water retention and drainage?
Soil aggregation supports crop productivity and environmental outcomes by improving water infiltration, moisture retention, erosion resistance, and organic matter protection.6 Reducing tillage preserves soil aggregates, as seen in KBS LTER experiments, where NT fields showed greater aggregation than CT within 10 years.7
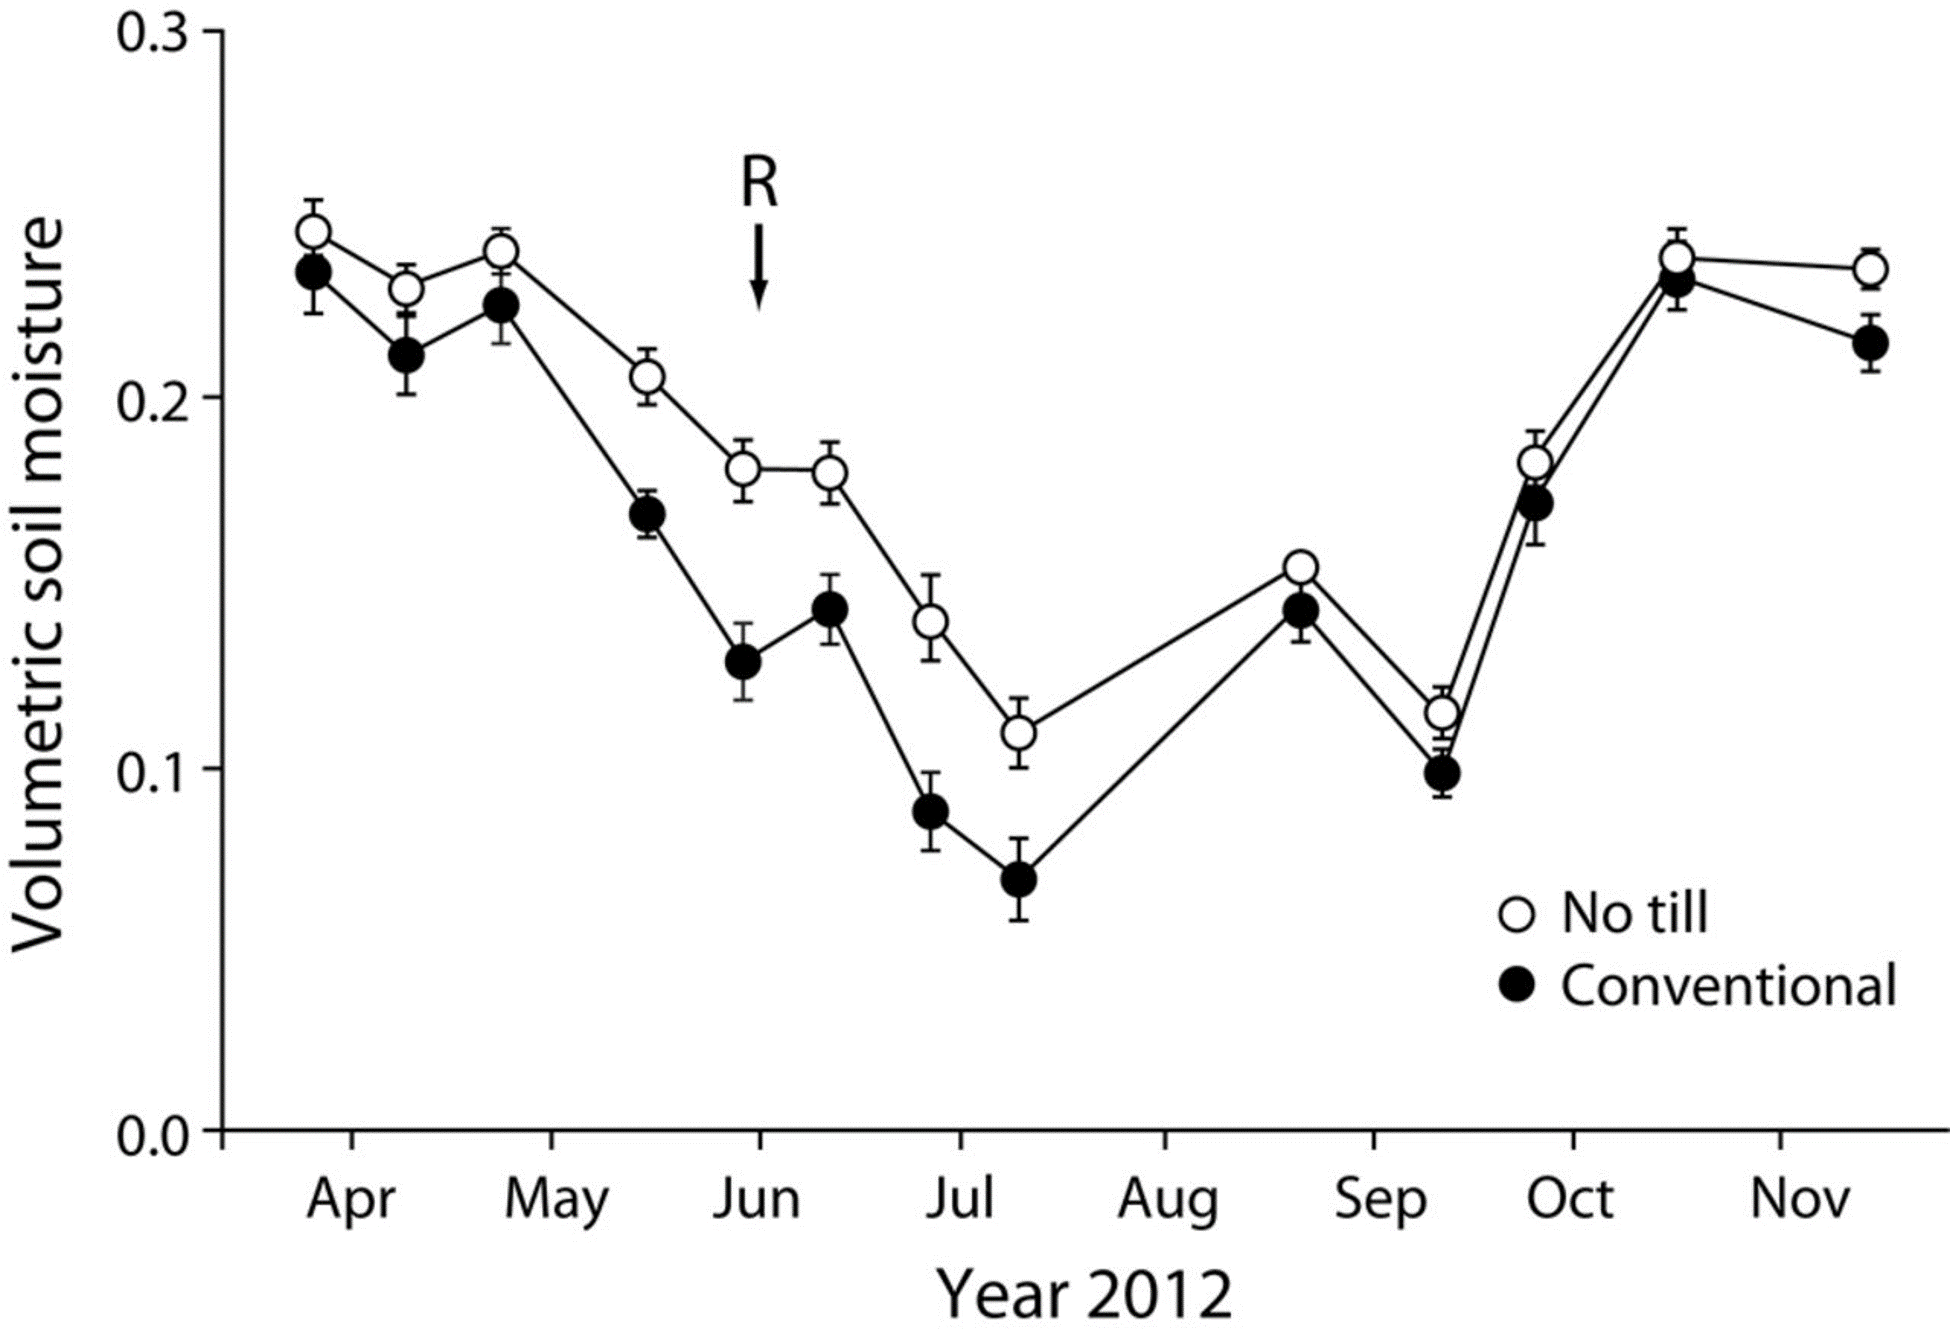
Between 1995 and 2006, NT fields had the highest infiltration rates of the four cropping systems, similar to a nearby undisturbed forest.10 NT also shows higher water-holding capacity than CT, particularly during droughts, such as in 2012 (Figure 3).10 This likely supported the higher soybeans yields in 2012.5
Soil Carbon Sequestration: Does soil carbon sequestration differ in tilled and no-tilled fields?
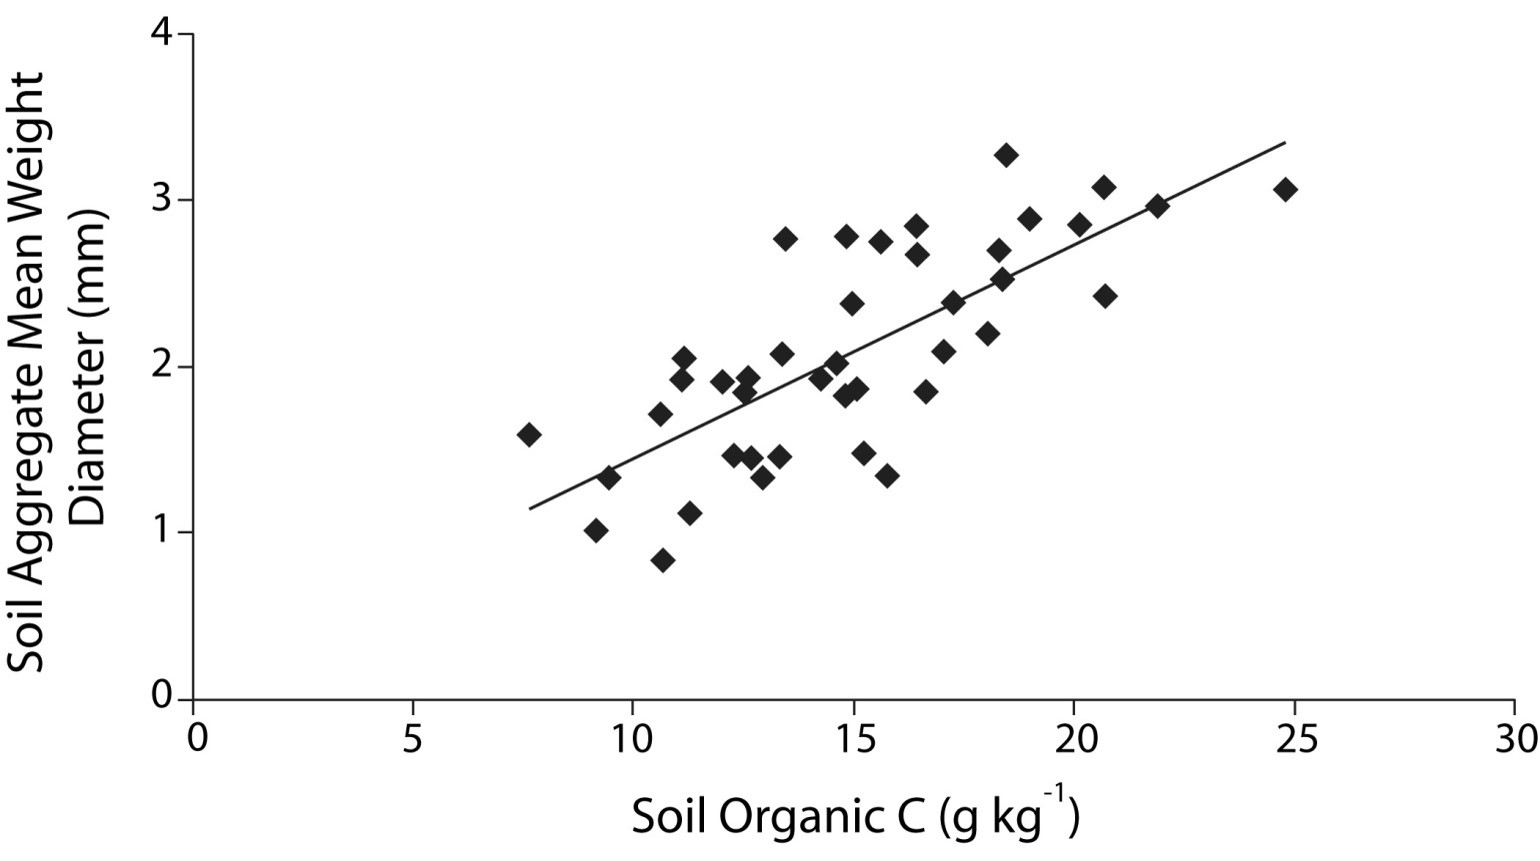
KBS LTER research revealed that the best way to reduce CO2 loss and build soil carbon was by protecting soil organic carbon (SOC) inside large soil aggregates.8 Larger soil aggregates have greater potential to contain more SOC (Figure 4). Therefore, farming practices that help soil form these aggregates are more likely to store more carbon in the soil. On the other hand, practices that break up soil aggregates cause more carbon to be released.
A KBS study also found that a single tillage pass on soil that was never farmed could reduce the amount of aggregation to amounts found on fields that had been tilled for more than 50 years.4 This highlights an importance way continuous NT management can realize soil carbon gains.
Greenhouse Gas Emissions: How have tilled and no-till fields affected greenhouse gas emissions?
Greenhouse gases such CO2, CH4, and N2O trap heat in the atmosphere once they are released. Soil and nutrient management (either through manure or fertilizer) have a significant impact on the release of these greenhouse gases.
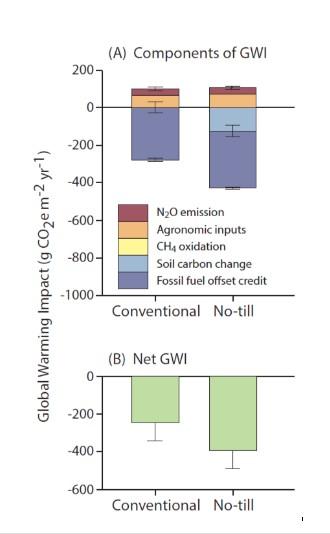
Global Warming Impact (GWI) measures how much heat an activity adds to the atmosphere, using "CO2 equivalents" (CO2e) for comparison. For example, releasing 1 gram of CO2 has a GWI of 1g CO2e, while 1 gram of nitrous oxide (N2O) has a GWI of 298g CO2e because it traps much more heat. NT fields in the KBS LTER have a lower annual GWI than CT largely due to the greater soil carbon accumulation (Figure 5).
In a study that evaluated greenhouse gas emissions six months after converting Conservation Reserve Program (CRP) land to field crops, CT was found to release 20% more N2O and 100% times more CO2 than when NT was used to convert the CRP land.11
Profitability: Is no-till more profitable over time? How long does it take?
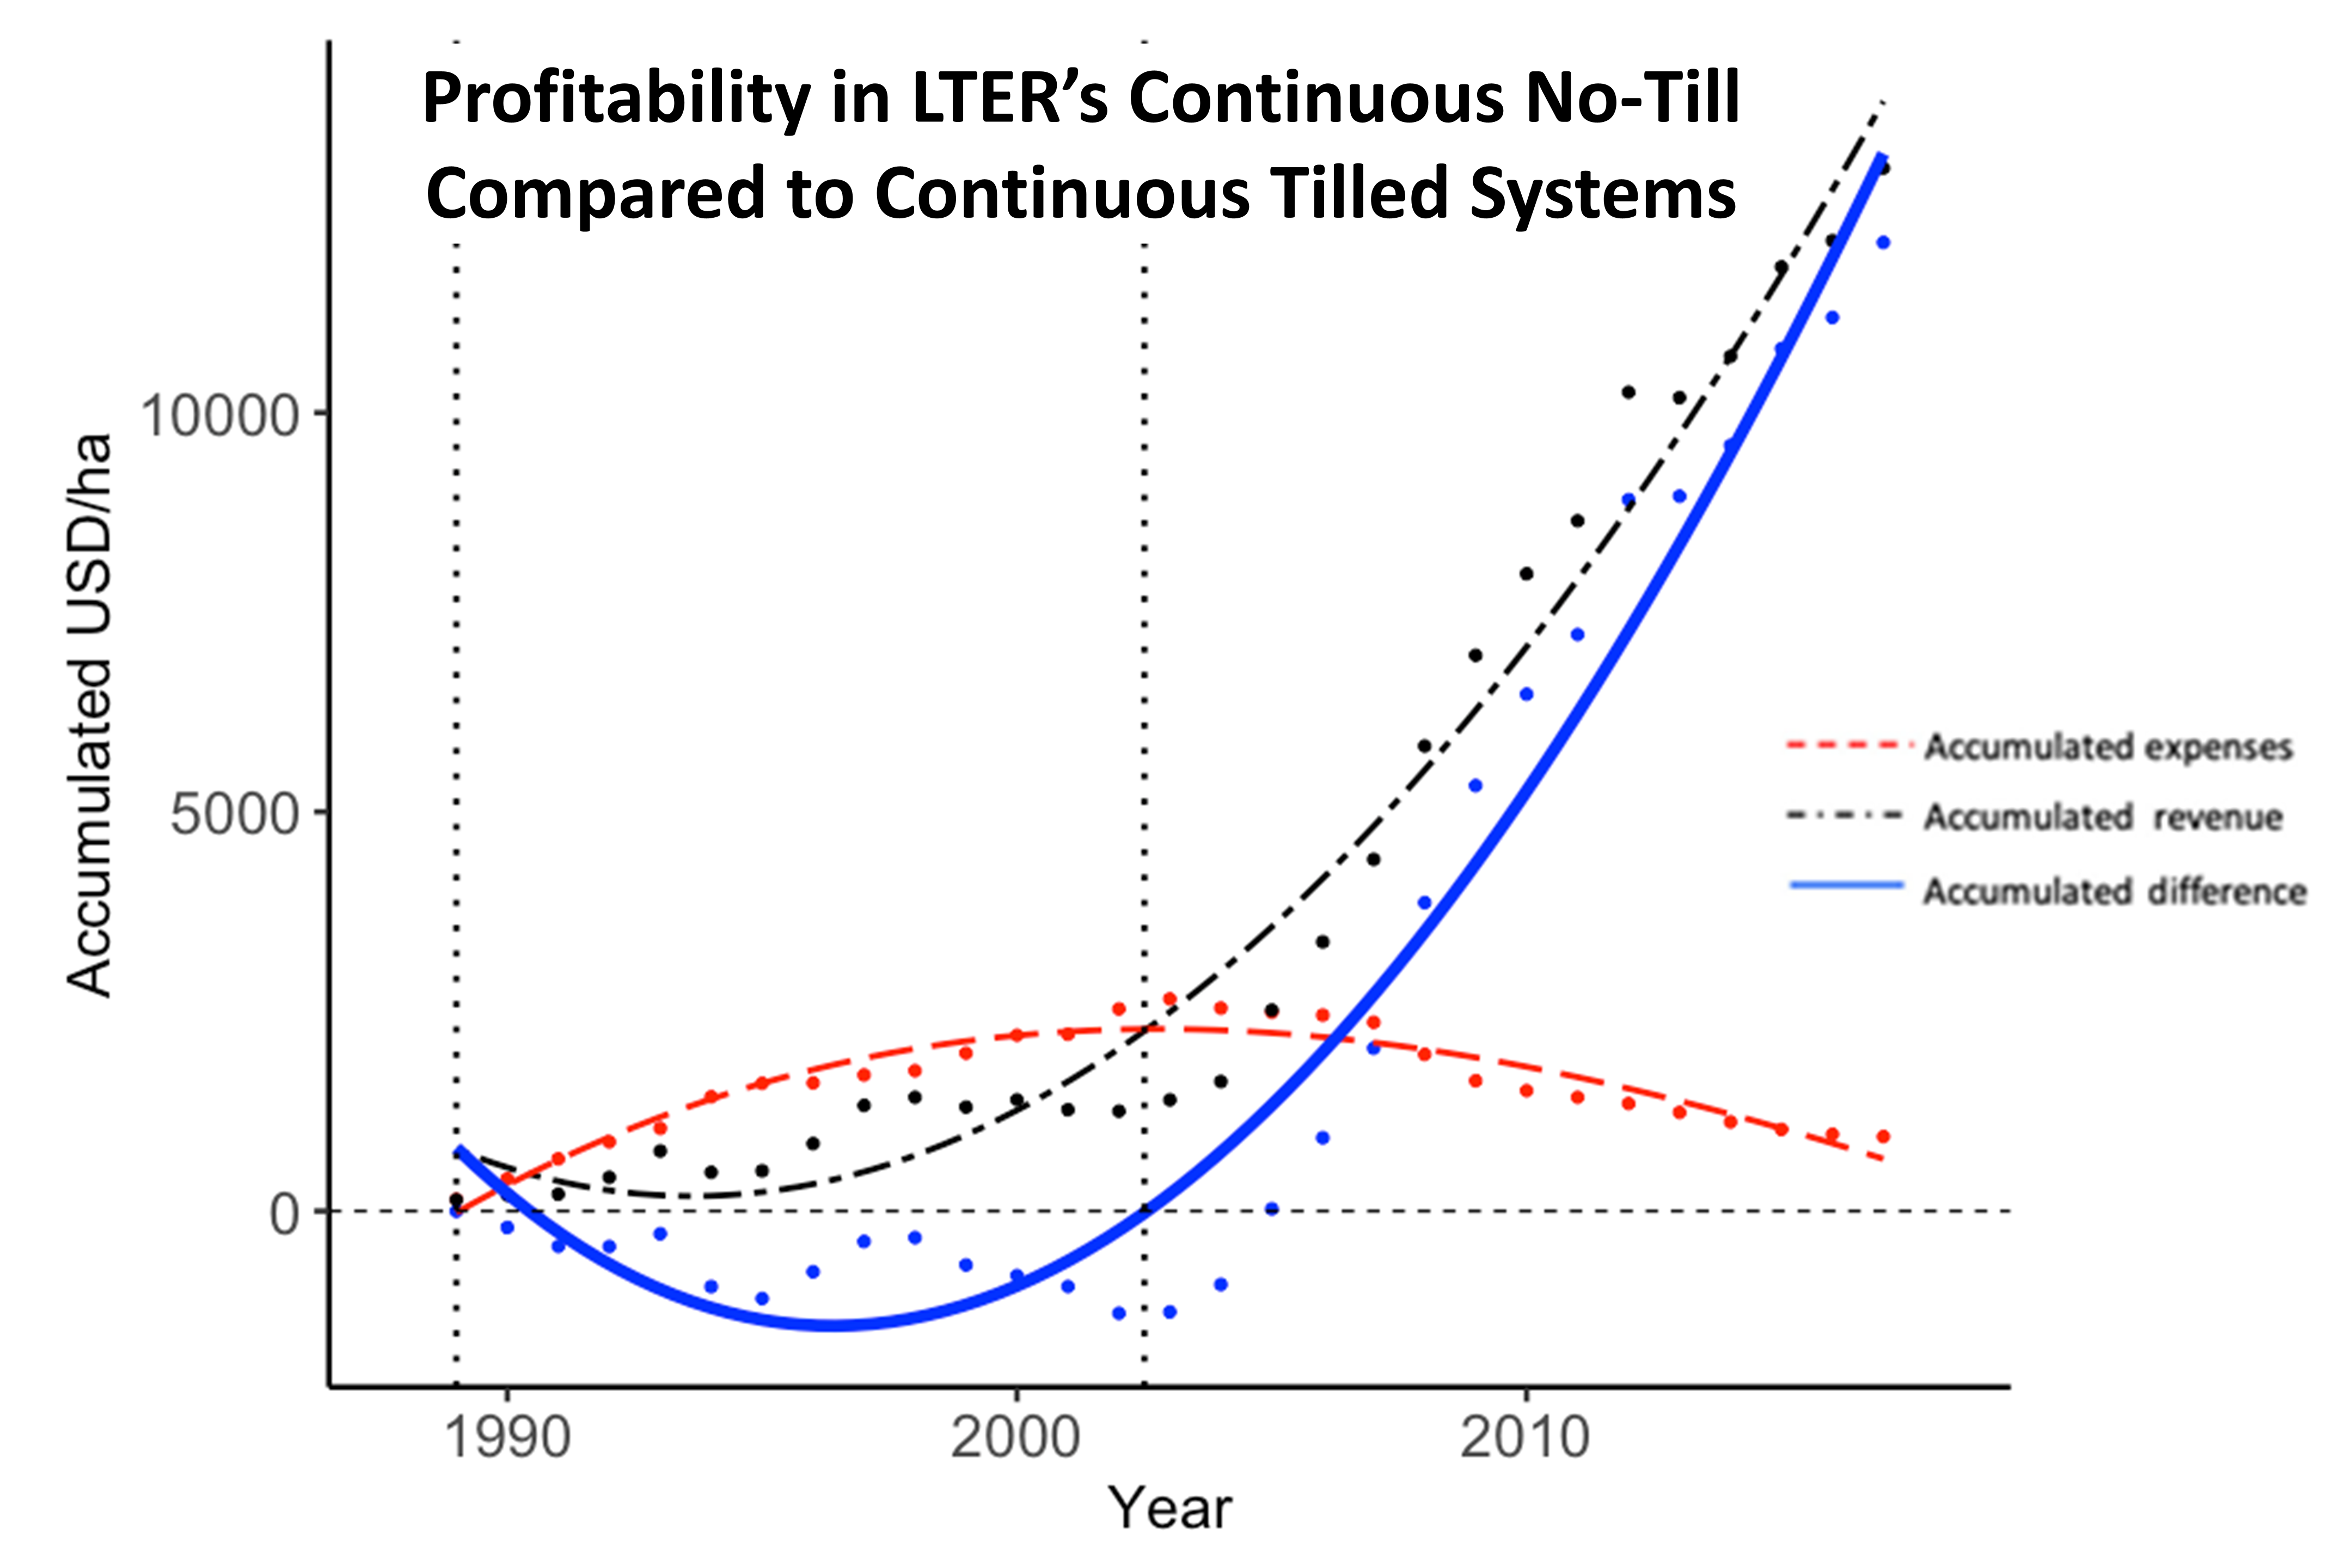
Financial sustainability is critical when it comes to the sustained use and adoption of any conservation practice. When comparing NT and CT systems year to year, CT had greater associated production costs due to labor and fuel costs, which ultimately led to a less profitable system than the NT fields.9 However, 13 years were needed to recuperate the costs associated with the purchase of NT equipment upfront. That said, profitability may be achieved more quickly if new machinery does not need to be bought, or if equipment is rented, cost-shared, or shared between multiple farms.
After recovering the expenses of the NT equipment, the KBS LTER site has seen increasingly greater profit in the NT system compared to the CT system year over year after 13 years (Figure 6). This increased profitability is due to both the reduced input costs in the NT system and increased yield.
Practice Considerations
Science Finding 1: In a study of tillage systems in soybeans across Michigan, including KBS, regional attributes (like climate and soil types) significantly influenced the yield potential of no-till management.13
The coldest regions of Michigan with higher clay or organic matter content were more likely to see declines in yields related to no-till than southern areas of the state and/or areas with coarser textured soils. However, delayed planting dates improved the ability to overcome these yield penalties.
Consideration 1: No-till systems require management customizations (equipment, variety, later planting date, etc.) based on region and soil type. Fields with sandy or loamy soil with lower organic matter, like those in the central to southern half of Michigan, may see faster yield benefits after transitioning to no-till than other regions with greater organic matter and clay.
Science Finding 2: No-till systems at KBS accumulated more soil organic carbon (SOC) than conventionally tilled soils. However, fields that had cover crops, even though they were tilled each year, surpassed the no-till fields with the total amount of SOC accumulated.14
Consideration 2: Cover cropping alone or in combination with no-till systems may be more effective at building soil carbon over time than no-till alone.
Science Finding 3: To reduce greenhouse gas emissions from field crop management, especially of N2O, a reduction of fertilizer inputs rather than just NT has been observed to reduce overall global warming impact most significantly.13
Consideration 3: Studies show that reducing fertilizer inputs does more to reduce overall global warming impacts than NT alone. Optimizing nitrogen fertilizer inputs can make NT systems even more carbon negative.
Sources
- Wade, T., Claassen, R., & Wallander, S. (2015). Conservation-Practice Adoption Rates Vary Widely by Crop and Region. http://www.ers.usda.gov/publications/pub-details/?pubid=44030
- Plastina, A., W. Sawadgo, and E. Okonkwo. 2024. “Cover Crop Adoption Decelerates and No-till Area Stagnates in the I-States.” Agricultural Policy Review, Winter 2024. Center for Agricultural and Rural Development, Iowa State University. https://agpolicyreview.card.iastate.edu/winter-2024/cover-crop-adoption-decelerates-and-no-till-area-stagnates-i-states.
- Islam, R., & Reeder, R. (2014). No-till and conservation agriculture in the United States: An example from the David Brandt farm, Carroll, Ohio. International Soil and Water Conservation Research, 2(1), 97–107. https://doi.org/10.1016/S2095-6339(15)30017-4
- Grandy, A. S., & Robertson, G. P. (2006). Aggregation and Organic Matter Protection Following Tillage of a Previously Uncultivated Soil. Soil Science Society of America Journal, 70(4), 1398–1406. https://doi.org/10.2136/sssaj2005.0313
- Robertson, G., N. Haddad, and S. Snapp. 2022. Agronomic Yields in Row Crop Agriculture at the Kellogg Biological Station, Hickory Corners, MI (1989 to 2021) ver 58. Environmental Data Initiative. https://doi.org/10.6073/pasta/88b4c974bdc9183f784f3a91b01086c6 (Accessed 2024-11-04).
- Grandy, A. S., Robertson, G. P., & Thelen, K. D. (2006). Do Productivity and Environmental Trade-offs Justify Periodically Cultivating No-till Cropping Systems? Agronomy Journal, 98(6), 1377–1383. https://doi.org/10.2134/agronj2006.0137
- Six, J., Paustian, K., Elliott, E. T., & Combrink, C. (2000). Soil Structure and Organic Matter I. Distribution of Aggregate-Size Classes and Aggregate-Associated Carbon. Soil Science Society of America Journal, 64(2), 681–689. https://doi.org/10.2136/sssaj2000.642681x
- Paul, E. A., Kravchenko, A., Grandy, A. S., & Morris, S. (2015). Soil Organic Matter Dynamics: Controls and Management for Sustainable Ecosystem Functioning. In The Ecology of Agricultural Landscapes: Long-Term Research on the Path to Sustainability. Oxford University Press.
- Cusser, S., Bahlai, C., Swinton, S. M., Robertson, G. P., & Haddad, N. M. (2020). Long-term research avoids spurious and misleading trends in sustainability attributes of no-till. Global Change Biology, 26(6), 3715–3725. https://doi.org/10.1111/gcb.15080
- Robertson, P. G., Gross, K. L., Hamilton, S. K., Landis, D. A., Schmidt, T. M., Snapp, S. S., & Swinton, S. M. (2015). Farming for Ecosystem Services: An Ecological Approach to Production Agriculture. In J. E. Doll (Ed.), The Ecology of Agricultural Landscapes: Long-Term Research on the Path to Sustainability (pp. 33–53). Oxford University Press.
- Ruan, L., & Philip Robertson, G. (2013). Initial nitrous oxide, carbon dioxide, and methane costs of converting conservation reserve program grassland to row crops under no-till vs. Conventional tillage. Global Change Biology, 19(8), 2478–2489. https://doi.org/10.1111/gcb.12216
- Dedecker, J. (2019). Targeting tillage intensity in Michigan soybean systems: On-farm observations and multivariate modeling of grower decision-making with implications for yield and soil carbon. PhD Theses. https://www.ideals.illinois.edu/items/112812
- Gelfand, I., & Robertson, G. P. (2015). Mitigation of Greenhouse Gases in Agricultural Ecosystems. In The Ecology of Agricultural Landscapes: Long-Term Research on the Path to Sustainability. Oxford University Press.
- Córdova, S. C., A. N. Kravchenko, J. R. Miesel, and G. P. Robertson. (2024). Soil carbon change in intensive agriculture after 25 years of conservation management. Geoderma, in press.


 Print
Print Email
Email


