New analysis shows no evidence of decline in steelhead natural reproduction
DOWNLOADSeptember 6, 2024 - Daniel O'Keefe, Michigan Sea Grant, Michigan State University Extension
 Print
Print Email
Email“There is no evidence for declining natural reproduction of steelhead in Lake Michigan tributaries. The number of naturally spawned steelhead that survive to Age-1 in Lake Michigan has shown no significant trend over the past twenty years. While numbers of any fish population do naturally fluctuate from year to year, there has been no declining trend in wild steelhead recruitment.
Spring returns of steelhead to the Little Manistee River weir have also seen no significant trend, either positive or negative, over the past twenty years. In looking at Age-0 steelhead abundance, there is no significant trend at the long-term monitoring site on the Little Manistee River, either. The same is true for Platte River, Bear Creek, Pere Marquette River, and Silver Creek sites included in the DNR’s Status and Trends Program.
There has been a significant increase in production of natural steelhead at the Bigelow Creek site, which is encouraging. It suggests that continued work to improve instream habitat, limit nonpoint source pollution, and improve fish passage can pay dividends when it comes to steelhead production.”
Full text of document
Introduction
Making sense of trends in fish populations can be a challenging task. Fish numbers naturally fluctuate from one year to the next based on weather, water levels, the abundance of predators, and a host of other factors. For example, over time invasive species led to massive ecosystem changes in the Great Lakes, and this had a dramatic impact on most fish species.
In Lake Michigan, steelhead numbers declined during the establishment and expansion of zebra and quagga mussels (collectively known as Dreissenid mussels). Michigan Department of Natural Resources biologists have shown that lakewide steelhead numbers dropped by roughly 50% from 2003 to 2004, but steelhead numbers in Lake Michigan have been relatively stable since 2004 as the lake’s ecosystem has adjusted to a new “post-Dreissenid” reality (see Slide 10 from this presentation).
Of course, those trends reflect all of the steelhead in Lake Michigan including those stocked in Wisconsin, Illinois, and Indiana. Michigan river anglers are most concerned with steelhead that return to Michigan streams during their spawning run. Fishing on some Michigan rivers depends mostly on fish stocked in Michigan, while other rivers depend mostly on steelhead that naturally reproduce. Many rivers receive runs of both stocked and wild steelhead.
Some anglers have voiced concern that natural reproduction of steelhead may be declining. Fortunately, the Michigan Department of Natural Resources has some long-term data sets available to shed light on possible trends in naturally reproduced steelhead in Michigan streams, and in Lake Michigan as a whole. The explanation below may get a bit technical, but it is necessary to understand how to determine which trends are likely to be meaningful and why.
How do we know which trends are real and which ones are not?
Fish populations experience a lot of natural variability. Much of this is due to normal variations in the environment. Fisheries biologists go through extensive training to learn how to analyze and interpret data, which includes considering alternative explanations. Oftentimes, looking at the numbers is only the first step. It is also critical to have firsthand experience on the water, watching how natural systems and fish populations respond to different environmental factors over time.
So, let’s look at some actual data and one of the analytical tools used to determine if trends are real or due to random chance. This tool is called “linear regression” and is also used in many other fields of study to determine if there is a relationship between two variables.
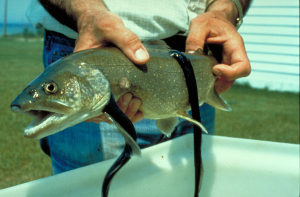
In this case, we will see if there is a relationship between the year and the number of steelhead returning to the Little Manistee River weir. The weir is a structure that temporarily blocks the migration of steelhead, allowing the DNR to collect eggs and milt to spawn the next generation of steelhead to be reared in hatcheries. The Little Manistee River itself is not stocked with fish, though. All of the steelhead used for egg take are naturally spawned. As such, the number of steelhead returning to the Little Manistee weir provides one long-term data set on a naturally reproducing steelhead population.
Looking at spring weir return data from 2021-2023, it seems like populations are increasing at first glance:
Little Manistee Adult Spring Steelhead 2021-2023 GRAPHIC
The line of best fit slopes upward, with the number of returning adult spring steelhead increasing from 1,611 in 2021 to 3,441 in 2023. The R-squared value of 0.9672 from the linear regression tells us that 96.72% of the variation in steelhead numbers is due to year. You might say “Eureka! Steelhead populations are booming!” Not so fast. The data in this example were misinterpreted because one critical analytical step was not taken.
The first step in this type of analysis is to determine if the slope of the line is significantly different from zero. The term “significance” has a very specific meaning in the context of statistical analysis and interpretation of scientific data. If you find that your result is significant then you can start talking about what you found and what it might mean. If your result is not significant then you have nothing. With no significant result, it is inappropriate to draw conclusions or guess at what might be causing the trend. After all, no significant result means that there is no evidence that a trend exists.
In the graph above, we see what looks like a very strong positive relationship. However, the first step in this analysis should have been to run a statistical test to determine if that nice ascending dotted blue line was significantly different than a flat line showing no relationship. To do this, we use an F-test and calculate a P-value. If P is less than 0.05, then we can say with 95% confidence that we have a real relationship between the two variables. For the graph above, P=0.116. The result is not significant, the blue dotted line should not be shown, and the R-squared value indicating 96.72% of variation explained by year is invalid (see this explanation for more on interpretation of regression results).
Of course, if you have paid attention to weir data and conditions on Michigan rivers for several years, you probably looked at that graph and cried foul immediately. Using that graph to assert that steelhead populations are booming would be highly disingenuous. That is why there are committed professional scientists working with one another to collect, analyze, and interpret data before making informed recommendations to fisheries managers and other decision-makers.
Now let’s take a look the same steelhead weir return data, but from a longer period of time. The graph below appears to show declining numbers of adult spring steelhead returning to the Little Manistee weir over the past two decades of the post-Dreissenid period.
So, we must go through the same process outlined above. First, and most importantly, does the P-value indicate significance? No it does not (P=0.123, which is greater than the 0.050 cutoff for a significant result). The downward sloping orange dotted line is not statistically different than a flat line, and the R-squared value should not be included because the (rather unimpressive) 13.44% of variation it explains is not significant.
Little Manistee Adult Spring Steelhead 2003-2022 GRAPHIC
So, there has been no significant declining trend in adult spring steelhead returning to the Little Manistee weir during the post-Dreissenid period – which is good news. The choice of beginning and end years can sometimes have an impact on the slope and significance of a trend line, but in this case it does not matter if we begin at 2003 or 2004, or end at 2022, 2023, or 2024. Any way you cut it; the trend is not significant.
It should be noted that weir return data should be interpreted with some caution. The weir does not operate on a year- round basis so the number of adults counted at the weir is not a complete count of steelhead returning to the Little Manistee River. Each year, the DNR allows some steelhead to pass upstream before lowering the weir to allow for those fish to naturally reproduce upstream. The number of steelhead that pass before the weir is lowered is unknown and could vary considerably from year to year. Also, although no steelhead are stocked in the Little Manistee, many steelhead stocked into other streams wind up straying into the Little Manistee.
Although weir return data are not ideal for investigating trends, the bottom line is that weir returns do not provide any significant evidence of a decline anyway. If there had been a significant trend, then we might start asking about what factors are influencing that trend and what management actions might be appropriate. However, there is no trend in spring returns of adult steelhead returning to the Little Manistee River over the past two decades.
Has steelhead natural reproduction been declining throughout the Lake Michigan basin?
Weir returns provide one source of data for a single river, but this may not be reflective of other Michigan streams that feed into Lake Michigan. To address overall trends in natural reproduction in Michigan streams, we can look at the number of naturally spawned recruits. These ‘wild recruits’ are steelhead that were naturally reproduced in Michigan streams AND survived their smolting and out-migration to Lake Michigan.
Since streams in other states bordering Lake Michigan (WI, IL, and IL) do not support much natural reproduction of steelhead, we can assume that virtually all of the wild steelhead recruits in Lake Michigan originated in Michigan streams. It is also important to note that these are Age-1 recruits – steelhead that spent approximately one year in a river environment before smolting, migrating downstream, and successfully transitioning to life in Lake Michigan.
The graph below shows a dotted blue line that slopes upwards, which would suggest an increasing trend over time. However, once again this result is not significant (P=0.247). The upward-sloping line is statistically no different from a flat line. Even though it is tempting to conclude that there is an increasing trend, this particular graph covering the past 20 years does not show a significant result and should not be interpreted as such. Of course, the good news is that it certainly does not offer any indication of decline, either.
Lake Michigan Age-1 Steelhead Wild Recruits 2003-2023 GRAPHIC
Have naturally reproduced steelhead been declining in specific Lake Michigan tributaries?
When looking at the production of natural steelhead in all Michigan tributaries of Lake Michigan taken as a whole, we see no evidence of decline over the past two decades. But have there been declines in individual streams?
The DNR Status and Trends Program involves several 1,000-foot sections of river that are surveyed using electrofishing on a regular (if not annual) basis. It is a statewide program, which includes sites on seven tributaries of Lake Michigan that support natural reproduction of steelhead. The density of Age-0 steelhead tells us how many young fish are present in nursery habitats where steelhead grow for approximately one year before leaving the stream for Lake Michigan.
The series of graphs below shows the number of Age-0 steelhead per acre at four of the seven sites. At first glance and without proper interpretation, the graphs appear to give the impression of declining steelhead reproduction. However, when we check for significance we find that none of the trend lines are meaningful.
Little Manistee R. Age-0 Steelhead 2002-2020 GRAPHIC
Platte River Age-0 Steelhead 2002-2020 GRAPHIC
Bear Creek Agea-0 Steelhead 1997-2019 GRAPHIC
Pere Marquette R. Age-0 Steelhead 2003-2020 GRAPHIC
These graphs provide a good example of how data can be misrepresented to give the impression of a downward trend when none exists. In each instance, the P-value is greater than 0.05, indicating that the blue dotted lines are not significantly different than a flat line drawn through the same points. The R-squared values are also extremely low, showing that very little of the variation in young steelhead abundance for each stream is explained by the line.
These four graphs also represent only four of the seven Lake Michigan tributaries sampled regularly by DNR for Age-0 steelhead. Furthermore, the years depicted on each of the graphs above are not consistent. While data are not available for all years on all streams, the graphs above do not include the most recent data available from the Michigan DNR’s Stream Fish Population Viewer, which includes data up to 2022 for some streams. Beginning years are also inconsistent on the graphs above, which include some years prior to the lakewide steelhead population decline due to Dreissenid mussels around 2004.
If we re-analyze the data for these four streams, include the most recent data available, limit our analysis to all data available for each stream beginning in 2004, and include the three additional streams not pictured above then we see a more complete picture. The graphs below keep the time periods as consistent as possible to allow for similar interpretation for the post-Dreissenid period on all streams with available data (as opposed to only four streams with different time periods for each, as shown above).
Little Manistee River Age-0 Steelhead - all available data for 2004-2022 GRAPHIC
Plate River Age-0 Steelhead - all available data 2004-2022 GRAPHIC
Bear Creek Age-0 Steelhead - all available data 2004-2022 GRAPHIC
Pere Marquette River Age-0 Steelhead - all available data 2004-2022 GRAPHIC
Silver Creek Age-0 Steelhead - all available data for 2024-2022 GRAPHIC
Bigelow Creek Age-0 Steelhead - all available data for 2004-2022 GRAPHIC
When we limit our analysis to the post-Dreissenid period beginning in 2004, we see a mix of upward-sloping, downward- sloping, and flat lines in Age-0 steelhead production over the past twenty years. At first glance, it would be easy to interpret this to mean that steelhead reproduction is increasing in some streams and decreasing in others. However, it is important to remember that the first step is to look at the P-value and determine if any of these trends are significant.
Most of them are not. There is no significant trend for Little Manistee River, Platte River, Bear Creek, Pere Marquette River, or Silver Creek since 2004. In fact, none of these streams exhibited significant declines when earlier years were included, either.
The situation looks better for Bigelow Creek, where work to improve fish passage and habitat quality began in 2016. Before 2008, Age-0 steelhead density was extremely low in Bigelow Creek, but the most recent data point shows 108 fish per acre in 2019. What is more, this trend line is actually significant (P=0.025). Since P is less than 0.05, we can say with 95% certainty that there is a real increasing trend for Age-0 steelhead in Bigelow Creek.
The DNR’s Status and Trends Program includes electrofishing data from six tributaries of Lake Michigan where steelhead reproduce naturally. This new analysis shows that no significant trends exist over the past two decades of the post- Dreissenid era for five of the six streams. One of the streams actually showed a significant increase in Age-0 steelhead production.
As with weir data, the Status & Trends Program data should also be interpreted with some caution. Each site is only a 1,000-foot long section of stream. If trends were significant for a site, it would not necessarily mean that the entire river showed a significant trend. In Bigelow Creek, for example, the increase we saw might have been localized to one 1,000- foot section instead of indicating an increase in productivity of the entire creek. Even so, the overall picture from these six sites where long-term data are available is certainly not a picture of declining Age-0 steelhead abundance.
The big picture
There is no evidence for declining natural reproduction of steelhead in Lake Michigan tributaries. The number of naturally spawned steelhead that survive to Age-1 in Lake Michigan has shown no significant trend over the past twenty years.
While numbers of any fish population do naturally fluctuate from year to year, there has been no declining trend in wild steelhead recruitment.
Spring returns of steelhead to the Little Manistee River weir have also seen no significant trend, either positive or negative, over the past twenty years. In looking at Age-0 steelhead abundance, there is no significant trend at the long- term monitoring site on the Little Manistee River, either. The same is true for Platte River, Bear Creek, Pere Marquette River, and Silver Creek sites included in the DNR’s Status and Trends Program.
There has been a significant increase in production of natural steelhead at the Bigelow Creek site, which is encouraging. It suggests that continued work to improve instream habitat, limit nonpoint source pollution, and improve fish passage can pay dividends when it comes to steelhead production.
MICHU-24-201