Bulletin E3530
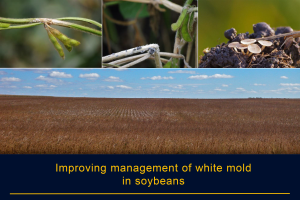
Soybean Irrigation Management
DOWNLOAD
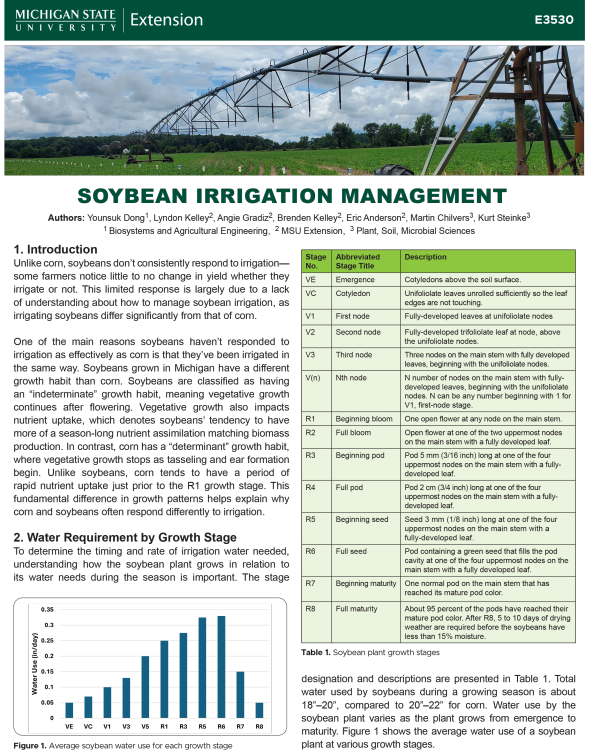
September 10, 2025 - Younsuk Dong, Lyndon Kelley, Angie Gradiz, Brenden Kelley, Eric Anderson, Martin Chilvers, Kurt Steinke, Michigan State University Extension
 Print
Print Email
Email1. Introduction
Unlike corn, soybeans don’t consistently respond to irrigation— some farmers notice little to no change in yield whether they irrigate or not. This limited response is largely due to a lack of understanding about how to manage soybean irrigation, as irrigating soybeans differ significantly from that of corn.
One of the main reasons soybeans haven’t responded to irrigation as effectively as corn is that they’ve been irrigated in the same way. Soybeans grown in Michigan have a different growth habit than corn. Soybeans are classified as having an “indeterminate” growth habit, meaning vegetative growth continues after flowering. Vegetative growth also impacts nutrient uptake, which denotes soybeans’ tendency to have more of a season-long nutrient assimilation matching biomass production. In contrast, corn has a “determinant” growth habit, where vegetative growth stops as tasseling and ear formation begin. Unlike soybeans, corn tends to have a period of rapid nutrient uptake just prior to the R1 growth stage. This fundamental difference in growth patterns helps explain why corn and soybeans often respond differently to irrigation.
2. Water Requirement by Growth Stage
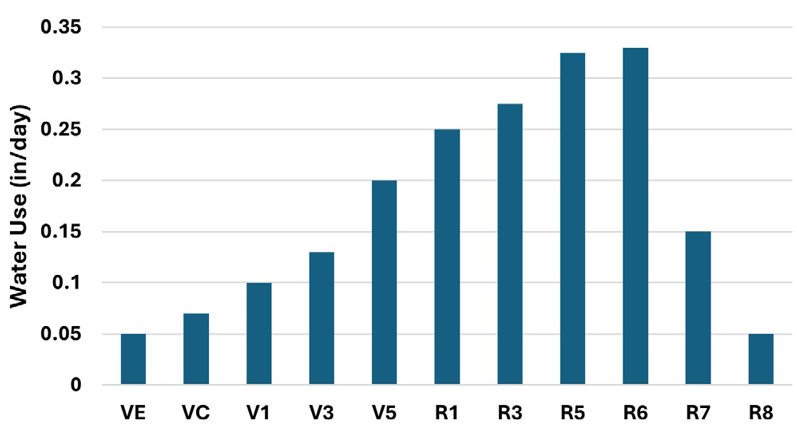
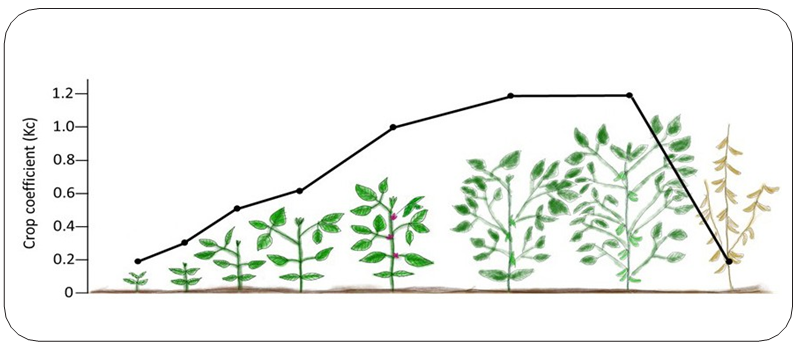
To determine the timing and rate of irrigation water needed, understanding how the soybean plant grows in relation to its water needs during the season is important. The stage designation and descriptions are presented in Table 1. Total water used by soybeans during a growing season is about 18”–20”, compared to 20”–22” for corn. Water use by the soybean plant varies as the plant grows from emergence to maturity. Figure 1 shows the average water use of a soybean plant at various growth stages.
Irrigating soybeans before the R3 stage is generally not recommended. Early irrigation can cause the upper stem internodes to grow longer, making the plants taller and more likely to lodge later in the season. It can also affect how roots develop. Watering too early, before emergence, may lead to shallow rooting that doesn’t correct itself later. For example, in the dry year of 2021, early irrigation caused soybean roots to stay near the soil surface for the rest of the season.
In extremely dry conditions, if irrigation is necessary during the vegetative growth stages of soybeans, water applications should be limited to ½–⅔ of the amount used for corn. Soybeans are generally more tolerant of early-season drought stress than corn. One of the earliest signs of water stress in soybeans is leaf rolling, particularly in the evening or morning. If leaf rolling becomes noticeable during these times, it may indicate the plants are not getting enough water. To avoid long-term stress and potential yield loss, it’s important to monitor these signs closely and apply just enough water to prevent the onset of visible stress while still encouraging deep root development. If wilting is observed, irrigation should be applied to mitigate stress. Growing soybeans at the vegetative stages should be maintained at 40%–50% field capacity, unlike corn at 50%–60%.
Water applications, when needed during flower and pod formation (stages R1–R4), should be proportionately higher. If the field has a history of high plant disease pressure, irrigation should be carefully applied during stages R1–R2 (bloom stages). During pod development and fill (stages R3–R6), water needs of the soybean are greatest, and therefore they should be irrigated at levels similar to corn. For the timing of the last irrigation pass, soybean irrigators should aim to maintain at least 50% of the available soil water-holding capacity until most pods have yellowed.
|
Stage No. |
Abbreviated Stage Title |
Description |
|
VE |
Emergence |
Cotyledons above the soil surface. |
|
VC |
Cotyledon |
Unifoliolate leaves unrolled sufficiently so the leaf edges are not touching. |
|
V1 |
First node |
Fully-developed leaves at unifoliolate nodes |
|
V2 |
Second node |
Fully-developed trifoliolate leaf at node, above the unifoliolate nodes. |
|
V3 |
Third node |
Three nodes on the main stem with fully developed leaves, beginning with the unifoliolate nodes. |
|
V(n) |
Nth node |
N number of nodes on the main stem with fully- developed leaves, beginning with the unifoliolate nodes. N can be any number beginning with 1 for V1, first-node stage. |
|
R1 |
Beginning bloom |
One open flower at any node on the main stem. |
|
R2 |
Full bloom |
Open flower at one of the two uppermost nodes on the main stem with a fully developed leaf. |
|
R3 |
Beginning pod |
Pod 5 mm (3/16 inch) long at one of the four uppermost nodes on the main stem with a fully- developed leaf. |
|
R4 |
Full pod |
Pod 2 cm (3/4 inch) long at one of the four uppermost nodes on the main stem with a fully- developed leaf. |
|
R5 |
Beginning seed |
Seed 3 mm (1/8 inch) long at one of the four uppermost nodes on the main stem with a fully-developed leaf. |
|
R6 |
Full seed |
Pod containing a green seed that fills the pod cavity at one of the four uppermost nodes on the main stem with a fully developed leaf. |
|
R7 |
Beginning maturity |
One normal pod on the main stem that has reached its mature pod color. |
|
R8 |
Full maturity |
About 95 percent of the pods have reached their mature pod color. After R8, 5 to 10 days of drying weather are required before the soybeans have less than 15% moisture. |
Table 1. Soybean plant growth stages
3. Soybean Irrigation Scheduling
Irrigation of soybeans can be scheduled using MSU Irrigation Scheduler smartphone app (Apple app store https://rb.gy/zog79j and Google Play store https://rb.gy/hd0qk1, soil moisture reading devices, or balance sheet methods, but particular attention must be placed on the growth stage and amount of application to soybeans.
3.1 Evapotranspiration (ET)-based irrigation scheduling
Evapotranspiration (ET)-based irrigation scheduling utilizes reference evapotranspiration and crop coefficients to estimate the amount of water lost from the soil through evaporation and used by the plant through transpiration. This method helps to track the soil moisture levels throughout the growing season to help with preventing under or overwatering. Crop evapotranspiration can be calculated using (Eq. 1).
(Eq. 1) ETc = ETref * Kc
Where,
ETc = Crop Evapotranspiration (in/day)
ETref = Reference Evapotranspiration (in/day)
Kc = Crop Coefficient (unitless multiplier)
Example:
Soybean (V1 First Trifoliate): ETc = 1.454 in * 0.6 = 0.87 in
Soybean (R1 Begin Bloom): ETc = 1.454 in * 1.0 = 1.45 in
To automate this calculation, you can use the MSU Irrigation Scheduler or MSU Irrigation Scheduling App (Apple version and Google version).
3.2 Soil moisture-based irrigation scheduling
Soil moisture sensors are valuable tools for scheduling irrigation, providing indirect measurements of soil water content through volumetric water content (VWC) or matric potential. VWC represents the ratio of water volume to the total soil volume, while matric potential indicates the force plants must exert to extract water from the soil.
To effectively interpret soil moisture sensor data, it is important to understand key soil moisture concepts:
- Saturation When all soil pores are filled with
- Field Capacity (FC) The maximum amount of water soil can retain after excess water has drained, usually 12–24 hours after heavy rainfall in sandy
- Permanent Wilting Point (PWP) The moisture level at which plants can no longer extract water, leading to irreversible wilting.
- Available Water (AW) The difference between field capacity and the permanent wilting point, representing the water available to
- Maximum Allowable Depletion (MAD) The portion of available water that can be used before causing plant stress, which varies by crop and growth stage.
Soil type significantly affects these values. Coarser soils (e.g., sands) retain less water than finer soils (e.g., silts and clays). If soil type is unknown, it can be determined using the Web Soil Survey at https://websoilsurvey.nrcs.usda.gov/app/
VWC sensors help estimate soil water depletion, but understanding available water-holding capacity is essential for accurate calculations since water-holding capacity varies by soil type (Table 2).
|
Soil texture |
Field Capacity (%) |
Permanent Wilting Point (%) |
Available Water (%) |
Trigger Point Range |
|
Sand |
9.4 |
5 |
4.4 |
6.8 – 8.1 |
|
Loamy Sand |
12 |
5.7 |
6.3 |
6.2 – 10.1 |
|
Sandy Loam |
17.9 |
8.1 |
9.8 |
12.0 – 15.0 |
|
Loam |
31 |
14 |
17 |
20.8 – 25.9 |
Table 2. Soil water content properties and recommended irrigation trigger points for different soil textures. Adapted from Dong et al., 2020.
Plant rooting depth also influences total available water. Deeper- rooted crops can access a larger water reservoir than shallow- rooted crops. To calculate the total water in the soil profile, multiply the VWC reading by the rooting depth. For example, if a 12-inch soil profile has a sensor reading of 15% VWC, the total available water is 1.8 inches (12 inches × 0.15).
Both soil type and depth can influence the sensor readings; therefore, proper sensor placement is required. Ideally, sensors should be placed at different depths to include variabilities in soil type:
- Single sensor — Install at half the root zone depth.
- Two sensors — Position at ¼ and ¾ or ⅓ and ⅔ of the root
- Three or more sensors — Distribute them across shallow, middle, and deep root zones to capture a representative moisture profile (Peters et al., 2013).
One of the key benefits of VWC sensors is their ability to indicate both when and how much water to apply. The maximum allowable depletion (MAD) serves as an irrigation trigger point, allowing plants to use available water while avoiding stress.
For soybeans, MAD varies by growth stage:
- Early-season (prior to R3): Previous studies have shown watering in early-season does not help with improving yields when rainfall is typical. During this stage, crop water demand is relatively
- Mid-season (peak water use): A 40–50% MAD is recommended to prevent water
- Late-season (maturity stage): MAD can be increased to 60–70% without affecting yield, as crop water demand decreases and temperatures
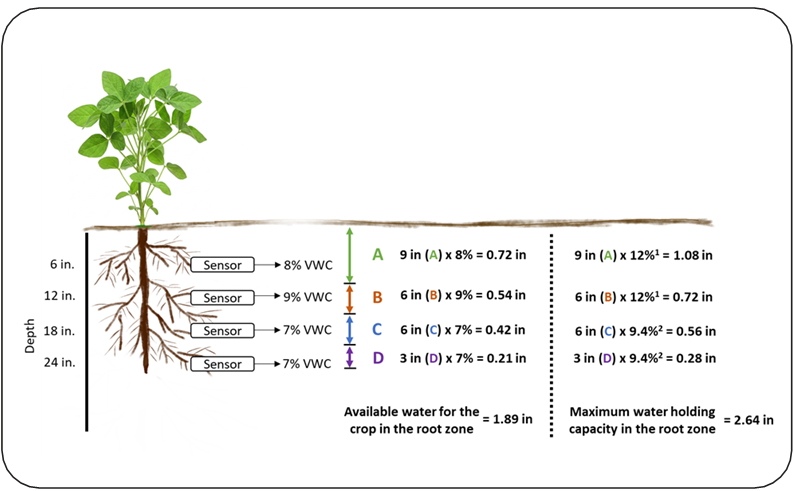
Once the MAD is established, soil water depletion can be estimated using sensor data. Figure 3 shows a calculation for determining the irrigation needs of a soybean plant. In this example, the root depth is considered to be 2 feet, with varying soil textures across depth intervals: 0–15 inches (loamy sand) and 16–24 inches (sand). Soil moisture readings were recorded at depths of 6, 12, 18, and 24 inches. Based on the data, the available water within the root zone is 1.89 inches, while the maximum water-holding capacity is 2.64 inches.
To schedule irrigation based on MAD, irrigation can be triggered at 50% of the water-holding capacity, meaning irrigation should be initiated when available water reaches approximately 1.32 inches. Depending on the system’s capacity, irrigation can either be scheduled within the next few days or aligned with the time required for the pivot to complete a full circle. If irrigation is applied immediately, approximately ¾ inches of water could be applied, assuming no precipitation is expected. However, it is recommended to leave room for potential rainfall events, if forecasted, to prevent water losses and improve irrigation water use efficiency.
Matric potential (tension-based) soil moisture sensors can help in irrigation scheduling. However, interpreting their data requires reference tables that estimate soil water depletion for different soil textures (see Table 3). For guidance on sensor placement and best practices, refer to the bulletin Improving Irrigation Water Use Efficiency: Using Soil Moisture Sensors.
Moreover, when scheduling irrigation, system constraints such as pumping capacity and application time should be considered. For example, in a center-pivot system that requires three days to complete a full irrigation cycle, it is important to estimate the water deficit over the next three days to determine the best time to start irrigation.
|
Soil texture |
Depletion in water-holding capacity (kPa) |
||
|
30% |
50% |
70% |
|
|
Sand |
20 |
30 |
60 |
|
Loamy Sand |
25 |
40 |
67 |
|
Sandy Loam |
28 |
50 |
80 |
|
Silt Loam |
80 |
150 |
250 |
Table 3. Soil matric potential for different soil textures at 30%, 50% and 70% soil water depletion (Irmak et al., 2014).
4. Plant Disease Management
White mold is one of the most significant disease threats to irrigated soybeans in Michigan. To reduce the risk of white mold, general principles of integrated disease management should be applied, which includes the selection of varieties with high levels of white mold resistance, reducing seeding rate where possible, and the use of an effective fungicide when warranted. Although planting in 30” rows does decrease risk of white mold compared to 15” or drilled soybean, it does not eliminate risk, and wider row spacing has potential drawbacks with respect to yield potential and weed control. Reducing irrigation input until the full pod (R4) growth stage will assist in reducing risk during the critical period for infection by the white mold fungus which is from beginning of flowering (R1) through the beginning of pod growth stage (R3). If a fungicide is desired, be sure to select a product that has efficacy against white mold and apply during the R1 to R3 growth stages. Fungicide applications before or after this critical crop stage will have decreased efficacy. A soybean fungicide efficacy chart can be found here that includes a column for white mold efficacy: https://cropprotectionnetwork.org/publications/fungicide-efficacy-for-control-of-soybean-foliar-diseases.
5. Agronomy Recommendations for Soybean Production Under Irrigation
Irrigated soybeans may produce additional dry matter production and therefore affect nutrient accumulation and possibly yield potential. Growers need to be certain that irrigation isn’t simply supporting additional biomass production without corresponding increases in yield. Greater biomass production may also enhance disease development or susceptibility through less air movement between rows and longer periods of leaf wetness. Higher yielding environments created through irrigation may impact nutrient strategies. Previous work has indicated grain yields nearing or greater than 70 bu/A, may be more probable for a yield response to N application (Barker & Sawyer, 2005; Wesley et al., 1998.) Increased soil moisture whether from rainfall or created through supplemental irrigation may also affect soybean S response. Low organic matter soils with minimal S application history and minimal carbon inputs such as manure or cover crops are key areas to target with regards to S applications in irrigated soybeans.
References
Barker, D. W., & Sawyer, J. E. (2005). Nitrogen application to soybean at early reproductive development. Agronomy Journal, 97(2). https://doi.org/10.2134/agronj2005.0615
Wesley, T. L., Lamond, R. E., Martin, V. L., & Duncan, S. R. (1998). Effects of late-season nitrogen fertilizer on irrigated soybean yield and composition. Journal of Production Agriculture, 11(3). https://doi.org/10.2134/jpa1998.0331