Dairy farm labor efficiency
Is your farm as efficient as it could be?

Efficiency is defined in the Merriam-Webster Dictionary as: “the ability to do something or produce something without wasting materials, time, or energy.” Labor efficiency is not defined by one clear indicator rather it is important to measure it in various ways. Michigan State University Extension helps farmers not only evaluate their efficiency, but also provides guidance to improve it.
Dairy farming is a labor-intensive enterprise. Cows are brought up to the parlor in groups and milked two or three times daily. Beds are cleaned during this time, alleys scraped, and fresh feed delivered. As cows exit the parlor, some may be separated out for breeding or examination. Meanwhile, milk is prepared for calves to be fed and someone is involved in caring for them. In the maternity area, someone is watching over those due to calve. During cropping season, work and often workers are added to accomplish timely planting, care, harvesting, and storage of crops. There are many moving parts, many people doing important jobs, and many opportunities to assess labor priorities.
Labor efficiency on dairy farms is a critical measure that impacts cost of production as well as the farm’s work environment. Surveys from the U.S. Department of Agriculture (USDA) have identified economies of scale and lower unit costs as herd size increases. In general, larger farms often use larger equipment, reducing the field work hours and increasing the output per person. Feeding a longer line of cows doesn’t require an additional person, delivery tractors, or mixer.
MSU Extension Educator Stan Moore and I have been examining labor efficiency on dairy farms to help farmers understand how they compare to others and identify practices that lead to improvement. Data was obtained from 20 dairy farms that range in herd size from 80 cows to more than 3,000 cows. There is certainly an impact of farm size on efficiencies including labor; however, the results obtained do not show a clear linear relationship between labor efficiency measures and number of cows milked, except with the very largest farms.
There are no perfect measures of labor efficiency and this database has limitations in comparing farms to one another. As might be expected, farms differ from one another in multiple ways. For example, some produce crops for sale as well as for feed, whereas others purchase a portion or even all of their feed. Farms also differ in what is custom or contract performed, such as heifer raising, breeding, or crop harvest; others do those jobs “in house.”
Some labor efficiency measures require a standard unit of labor. The standard is FTE or full time equivalent. In agriculture, we use 2,500 hours per year as FTE. This is greater than the typical workplace equivalent of 2,000 hours or 40 hours per week multiplied by 50 weeks. However, even this is not a simple measure. We asked farmers to provide the number of full-time worker-equivalents including themselves and family, paid or unpaid, who work on the farm. Many owners and some salaried employees don’t punch a time clock. Therefore, one FTE may not be directly comparable to another FTE unless a farm business quantifies all work performed by all individuals.
In measuring efficiency, one can look at the amount of labor input used by a farm. Measures of this type include: cows per FTE, labor cost as a percentage of revenue, and labor cost per hundredweight of milk shipped. Alternatively, we can look at the output per unit of labor input with measures that include milked shipped per FTE and gross revenue per FTE. Each measure tells a story and using multiple measures provides some balance to the limitations of individual measures.
Let’s look at measures from both of those efficiency perspectives: cows per FTE and labor cost per hundredweight (cwt.) of milk (measures of labor input) and gross revenue per FTE (a measure of output per unit of labor).
Labor inputs
Cows per FTE is a simple measure that reflects efficiencies related to farm set-up and organization, as well as parlor type and standardization of management. The data collected ranged from a low of 25 cows to a high of 105 per FTE. Certainly, as parlors have become larger, it is possible to milk cows at an increasingly efficient rate. It seems intuitive that more cows per employee is more efficient, but cow care is not necessarily efficient. Cow care takes time. Quality milk is critical and we don’t want to compromise achieving it.
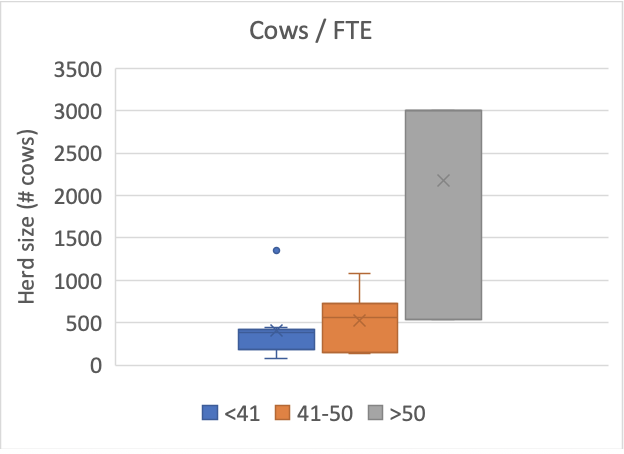
We divided the data on cows per FTE into three groups: less than 41 cows per FTE, 41 to 50 cows per employee, and greater than 50 because farm numbers split well across those three ratios (Figure 1). The bars indicate the middle range (second and third quartiles) of farm size in each ratio. For the first bar, less than 41 cows per FTE, there were nine data points with herd sizes ranging from 80 to around 1400 cows with a mean (average) of 402 cows. The dot above the bar is a data point for the largest farm in the set, which is above the normal range. The second bar, 41 to 50 cows per FTE was data from seven herds ranging from 140 cows to around 1100 cows, with a mean of 522. The third bar was data from three herds with cows per FTE greater than 50 and was from farms with around 550 cows to more than 3000. From this description, one can see a wide range of farm sizes in every cow per employee ratio breakout.

Labor cost per cwt., shown in Figure 2, is inversely related to cows per FTE. Labor as a cost of production is usually the second greatest cost on the farm after feed. The higher it is, the less able a farm is to lower milk prices. Again, we divided labor costs (all costs including owner draw) into three ranges based on farms per each group. Eight farms are represented by the first bar (less than $3 per cwt.) with a range in farm size of around 150 cows to greater than 3000. The middle bar is represented by seven farms with a range of 80 to around 1400 cows, and a mean of 662 cows. The highest labor cost of production, greater than $4.50 per cwt., is represented by five farms with a herd size range of around 140 to 400 cows and a mean of 258 cows.

When farms are grouped this way, it can be easy to miss the real difference that farms are able to achieve. For example, if we look at the annual cost of two theoretical farms from the middle bar at the mean of 662 cows, with one having a $3 labor cost of production and another, at the same size of $4.50 per cwt.,the difference, assuming 25,000 pounds (250 cwts.) of milk per cow and 90 percent of cows in milk, is $223,425; yet both are represented in the middle bar. That highlights the even greater difference in farms from the first bar to the third bar.
Labor productivity
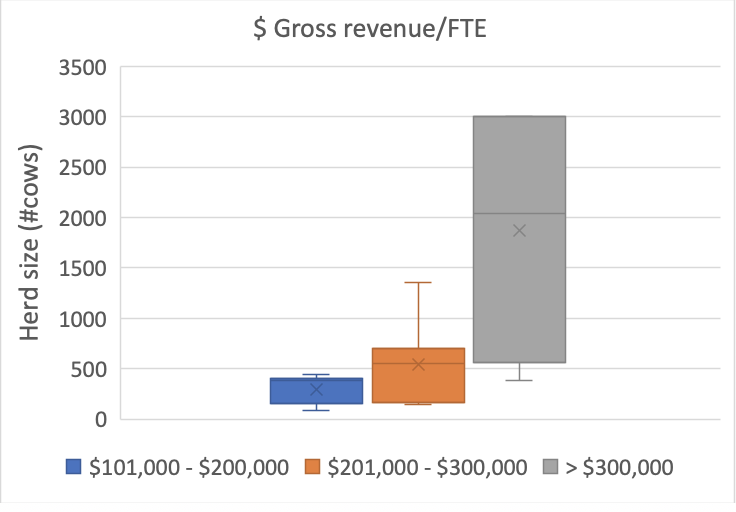
When we look at the productivity side of labor, we see similar results. In Figure 3, the gross revenue per FTE is graphed. It varies greatly, from less than $200,000 to greater than $300,000. Indeed, there was a fivefold difference between the farms at either end of the range of gross revenue per FTE among the 20 farms we looked at.
Again, the range in farm size with increasing revenue per employee has no clear pattern until the largest farm sizes are reached. For example, the seven farms represented by the first bar ($100,000 to $200,000 revenue per FTE) range in size from around 80 to 450 cows, and the second bar ($201,000 to $300,000), eight farms from around 140 to 1400 cows. Even the third bar, with gross revenue greater than $300,000 per FTE represented four farms from around 380 cows to those with more than 3000 cows.

These ranges suggest that increasing labor efficiency is not as simple as increasing cow numbers. It raises questions about why it takes more people to handle cows on some farms versus others. We believe that this data reveals that efficiencies can be gained at all farm sizes.
Revenue might seem like a good way to measure efficiency because every dollar spent on labor is an investment that should pay back much more than that dollar. However, revenue alone does not capture the variation in costs based on employee know-how, initiative, or carefulness. An employee who makes a mistake that results in milk being dumped, gates being replaced, or a cow dying, increases costs over an employee who responds better. So, gross revenue per FTE is likewise only one indicator of labor efficiency.
As tempting as it is for us to set a goal for each measure, the better solution is for you to set a goal for each measure. There is no “good” level or “bad” level, there are simply better or worse ones. You can always get better and the higher efficiency levels attained by some farms provides the proof of that. Even at the highest efficiency levels, there is room to grow.
If greater efficiencies are both beneficial and possible, then how can they be achieved? Based on work with farms on labor management for years, Stan and I believe the answer is not in driving employees harder or eliminating employees and making others work more hours. We believe the answer is in how owners and managers work with people in partnership to achieve the goals of the business. The reality is that some teams function at a higher level than others and that can be on large farms or small to mid-size farms. Higher functioning teams are more productive. Another article will highlight factors to improve labor efficiency.
It would be good for farms to track several measures of labor efficiency with the understanding of the limitations of each. With that though, farm owners and managers need to have open and honest discussions with employees about the measures and how they can help improve them. Transparency is important in business.
This year, measures that involve gross revenue will be different. Place your emphasis on other measures to see how one year compares to the next. However, don’t ignore measures that are revenue based, because it is precisely in years like this that those take on a greater importance.
For more information on labor management, see: https://www.canr.msu.edu/dairy/business_management/labor-management. The work of employing, developing, and guiding people is the next level of farm management in which many need to improve. Among the results will be increased labor efficiency.


 Print
Print Email
Email


