Monitoring and Data Collection: A Summer Journey Through Regenerative Agriculture
 Print
Print Email
EmailMonitoring and Data Collection: A Summer Journey Through Regenerative Agriculture
Summers are the busiest time of year for most farmers. Similarly, once the grass starts growing our team gets going. In this newsletter I am going to share with you about the monitoring and data collection I get to do. The use of the phrase “get to do” is intentional here because summer if my favorite time of year. For those who don’t know me, my name is Morgan and I am a researcher working on the Metrics, Management, and Monitoring: An Investigation of Pasture and Rangeland Soil Health and Its Drivers project. We refer to this as the “3M Project” for short. Specifically, I work on the monitoring and education module which primarily consists of conducting EOV monitoring and facilitating courses on regenerative grazing management planning and practices, especially pasture monitoring.
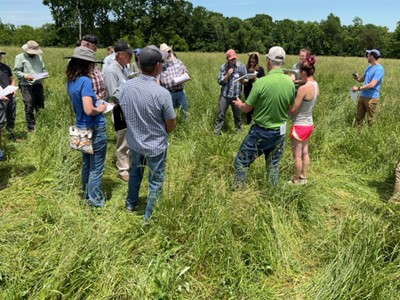
In May, Dr. Matt Raven, Crista Derry, and myself traveled to Green Acres Farm in Cincinnati to teach a hands-on Ecological Outcomes Verification (EOV) course for 15 to 20 people over the course of two days. Then, we setup the monitoring plan, with the farm managers, and began our monitoring season at Green Acres’ Sleep Hollow Farm. Currently, Matt, Crista, and I monitor 50 farms/ranches in Michigan. The monitoring we currently conduct is supported through our research grants and the monitoring is typically data collection for our research projects.
When I use the word monitoring, I am referring to EOV monitoring. EOV is an assessment of ecosystem health and functioning that involves using all five of our senses. If you read the blog post from last month, the things Michelle wrote about as vital to ensuring resilience and soil health are reflected in the indicators. These indicators include:
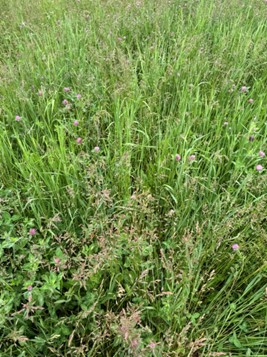
- Do you have living forage in your pasture? Is the canopy abundant and healthy?
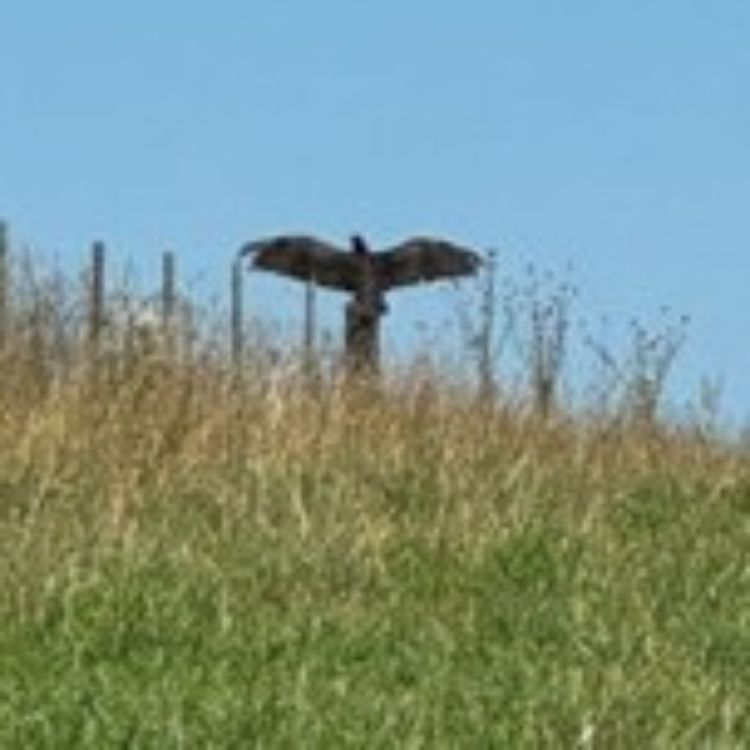
- Do you have microorganisms present and abundant (i.e., butterflies, spiders, beetles)?
- Do you have warm/cool season perennial grasses that are vigorous and reproductive?
- Do you have forbs and legumes that are vigorous and reproductive?
- Do you have trees and shrubs that are vigorous and reproductive?
- Do you have species that indicate a declining ecosystem and how abundant are they?
- Do you have species that indicate a healthy ecosystem and are they abundant?
- Do you have an abundance of forage litter covering the soil?
- Is that litter decomposing
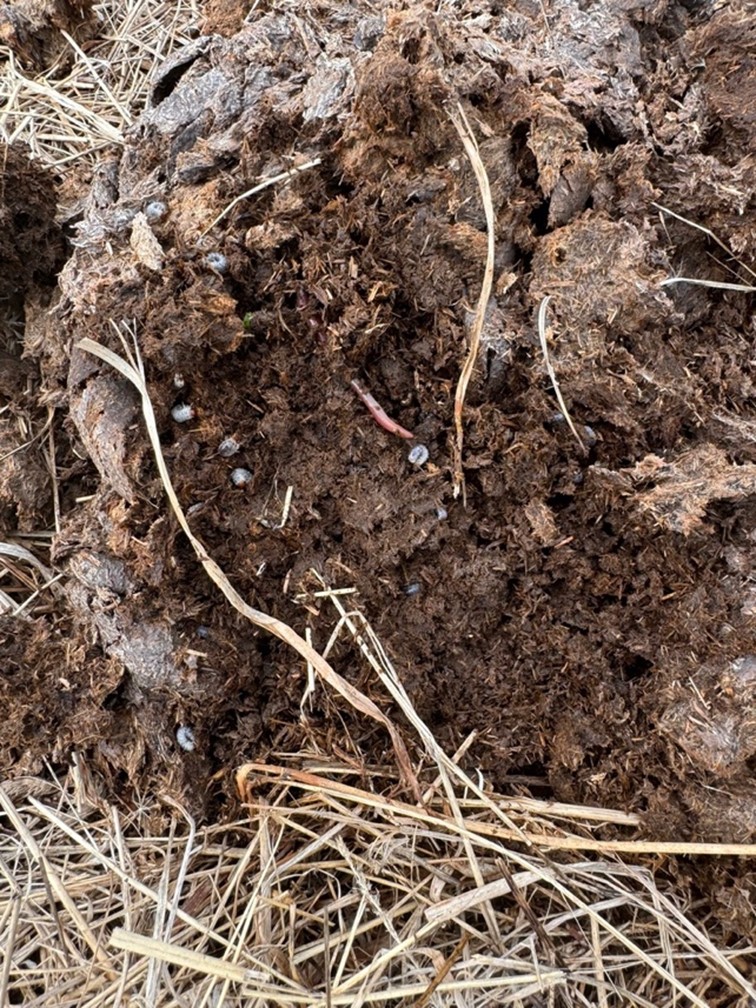
- Is the manure decomposing?
- Do you have any bare ground and if so, how much?
- Do you have signs of soil capping?
- Do you have signs of wind/water erosion?
We evaluate these indicators at a minimum of 10 sites on each farm and use these scores to assess the current state of the pastures and the farm as a whole. Because of how the monitoring protocol is designed, we can look at scores across a region, but more importantly the scores are valuable for the producers to track and use the trends to monitor how their grazing management practices are impacting the health of the pasture ecosystems they steward.
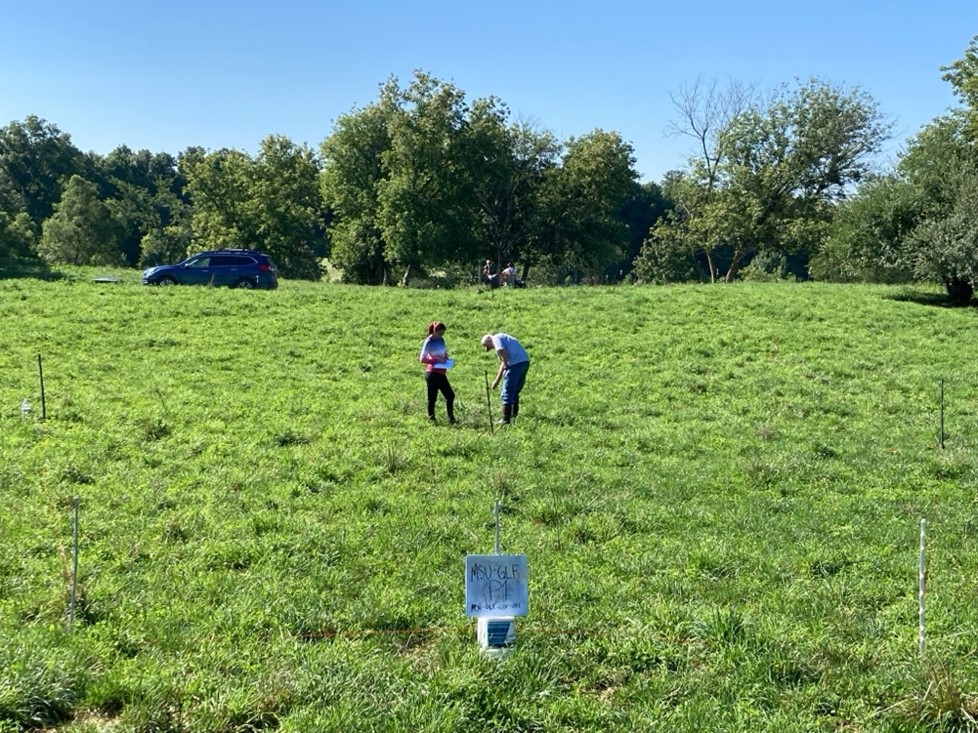
Within the 3M project, we are working with 19 farms in Michigan and overseeing the monitoring of 20 ranches in Wyoming and Colorado, and another 20 in Oklahoma and Texas. Each property has 21 monitoring sites and 12 of those match the place where other research teams are also collecting data so we can compare with each other what we are seeing and finding. We also have a long-term monitoring site that we set up at each producer’s property. At this site we use a plant evaluation technique called “line-point intercept with flex area,” which means we look at 100 individual points on two 25-meter lines, also called “transects.” This involves identifying every plant that is touching the line at each point. We write down which species these plants are and how many are present. 17 photographs are taken of the area we are monitoring to document what we see, take soil samples, and measure water infiltration rates. It takes us about 2 hours to do, and that’s when we have extra hands to help us; when Crista and I attempted to do one by ourselves it took us over 3 hours.
You are likely wrapping up production and harvesting over the next 4-6 weeks, writing your own reports and notes, and then you will begin planning for the next year. Honestly, our lives also cycle with the seasons of farming. We are just wrapping up all the monitoring work now, and after this Crista and I will spend the fall reporting the ecosystem health results back to each of our partner producers. Winter is for analyzing research project data, writing up findings, presenting our research, and planning education and monitoring for the following year. I am grateful to each of the producer partners we have for sharing their farms with us and I look forward to working with more of you in the future.
If you are interested in knowing more about EOV monitoring and would like to view our online training, you can access it via this link or send me directly at mathiso9@msu.edu and I will help you get started.