Shifting patterns of aster yellows risk across two growing seasons in Michigan
 Print
Print Email
EmailRecent observations from 2024 and 2025 show that aster leafhopper infectivity is highly dynamic.
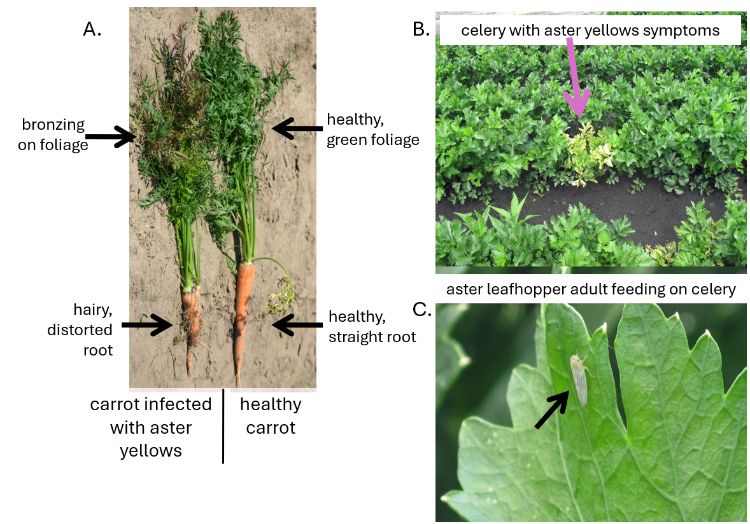
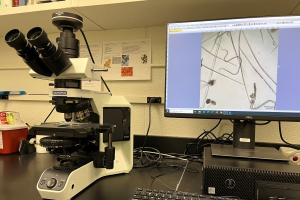
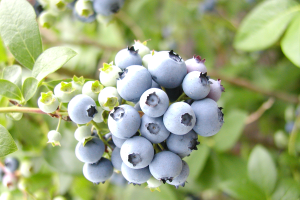
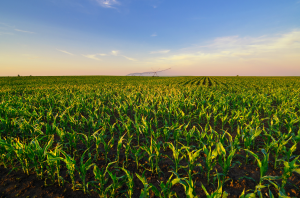
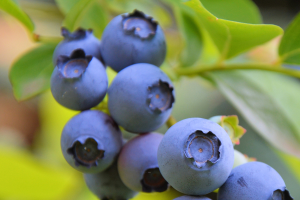
Starting every May in Michigan, aster leafhoppers bring the risk of aster yellows disease to crops like carrot and celery (Figure 1). The key concern is not leafhopper abundance, but the proportion that are infective, which shifts throughout the season (Figure 2). For growers, the challenge is timing: when risk begins, peaks and declines.
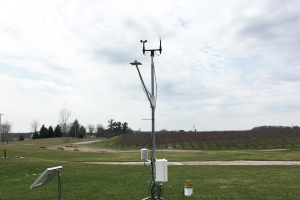
Observations from 2024 and 2025 suggest infectivity is highly variable across crops, timing and year, driven by both migrating insects and local disease sources (Figure 3). However, these observations are based on only two seasons, so they should be viewed as early indications rather than long-term trends. Both years were warm across Michigan, with Michigan’s lower peninsula averaging about 73 degrees Fahrenheit in summer, slightly above normal, and with 2024 among the warmest on record. While warm conditions support insect activity and crop development, they do not fully explain differences in infectivity.
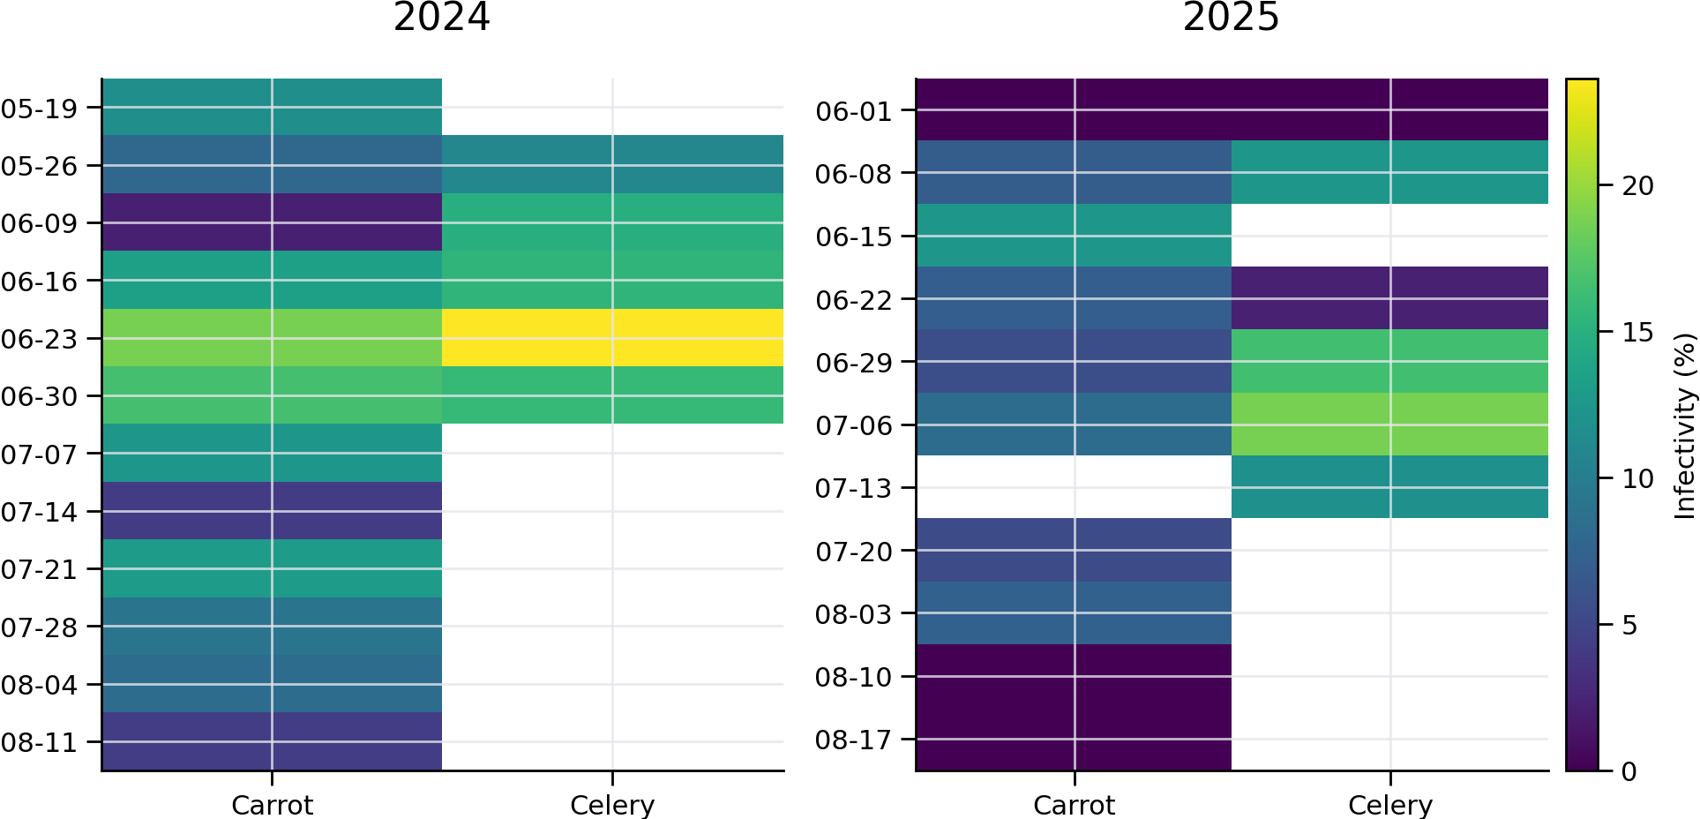
In both seasons, infectivity was low in May, increased through mid-summer and declined later, but timing and intensity varied between years (Figure 3). In May, westerly winds dominated both years, resulting in low infectivity. In June, the two years diverged: in 2024, in mid-June, infectivity increased, while in 2025, peak infectivity occurred in late June-early July. Additionally, 2025 exhibited stronger week-to-week variations in infectivity.
Patterns of infectivity in carrot and celery differed: carrot showed short, sharp spikes in infectivity, creating brief but high-risk windows. Celery showed lower but more sustained levels of infectivity, resulting in prolonged moderate risk rather than distinct peaks.
Findings reinforce key principles for managing aster yellows risk
- Timing matters more than averages: risk is driven by short periods of high infectivity, not seasonal averages
- Mid-season is critical: across both years and crops, the highest infectivity occurred during the mid-summer window
- Crop-specific strategies are needed:
- Carrot - rapid response to short, intense risk periods
- Celery - consistent management
Sign up to receive text messages during the growing season about aster leafhopper infectivity in Michigan here.
This work is supported by the Crop Protection and Pest Management Program [2024-70006-43569] from the USDA National Institute of Food and Agriculture. Any opinions, findings, conclusions, or recommendations expressed in this publication are those of the author(s) and do not necessarily reflect the view of the U.S. Department of Agriculture.