Bulletin E-3511
Bulletin E-3511 Insurance Options for Swine Growers
DOWNLOAD
February 12, 2026 - Jonathan LaPorte
 Print
Print Email
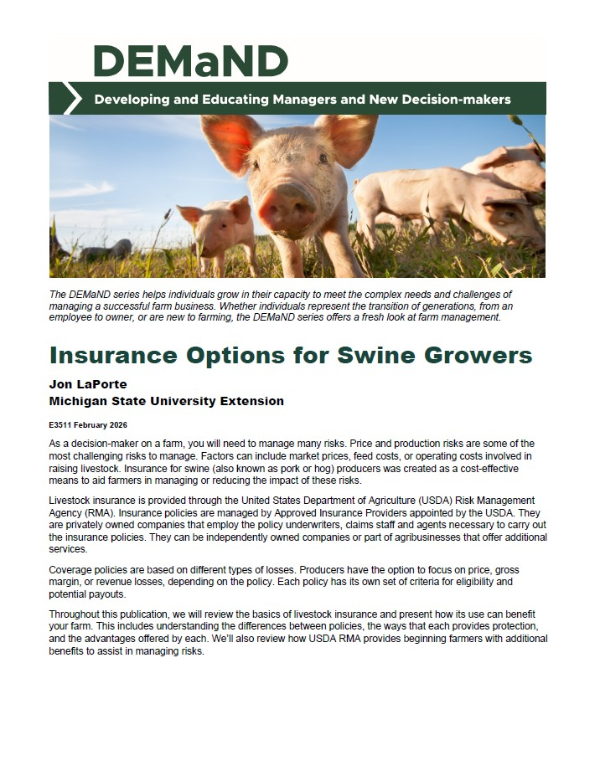
EmailAs a decision-maker on a farm, you will need to manage many risks. Price and production risks are some of the most challenging risks to manage. Factors can include market prices, feed costs, or operating costs involved in raising livestock. Insurance for swine (also known as pork or hog) producers was created as a cost-effective means to aid farmers in managing or reducing the impact of these risks.
Livestock insurance is provided through the United States Department of Agriculture (USDA) Risk Management Agency (RMA). Insurance policies are managed by Approved Insurance Providers appointed by the USDA. They are privately owned companies that employ the policy underwriters, claims staff and agents necessary to carry out the insurance policies. They can be independently owned companies or part of agribusinesses that offer additional services.
Coverage policies are based on different types of losses. Producers have the option to focus on price, gross margin, or revenue losses, depending on the policy. Each policy has its own set of criteria for eligibility and potential payouts.
Throughout this publication, we will review the basics of livestock insurance and present how its use can benefit your farm. This includes understanding the differences between policies, the ways that each provides protection, and the advantages offered by each. We’ll also review how USDA RMA provides beginning farmers with additional benefits to assist in managing risks.
Livestock Risk Protection
During times of increased volatility in hog markets, one important management tool that producers can utilize is price protection. RMA has implemented a market price insurance program called “Livestock Risk Protection” (LRP) since 2004. Swine producers who take the opportunity to obtain this market price protection can stabilize their income during times of falling hog prices.
The LRP program allows producers to purchase market price protection insurance against falling markets. This insurance policy can be used for various size operations, giving both small and large producers an opportunity to obtain market price protection.
It is critically important to point out that LRP policies offer market price protection. It has no impact on the price producers receive from purchasers (feedlots, processors, etc.). Hogs are sold and marketed by producers in the method of their choosing. Consequently, producers are still encouraged to market swine to the best of their ability. The actual LRP policy is only insurance against hog market prices going lower.
Swine contracts can be purchased for as few as one hog and up to 70,000 hogs per contract, each referred to as a Specific Coverage Endorsement (SCE).. Each hog producer has an annual limit of 750,00 hogs per crop year.. A crop year is considered July 1 through June 30.
Livestock eligible for coverage includes both live swine and unborn swine. Unborn swine must have a target lean weight of at least 1.40 cwt or live weight of 189 pounds at the end of the insurance period. Live swine must be expected to weigh between 1.40 to 2.60 cwt lean weight (or 189 to 351 pounds live weight) by the end of the insurance period.
Producers can insure coverage prices ranging from 75 percent to 100 percent of the expected end value. Note: Coverage does not include the loss, death, or destruction of any swine.
Table 1: Swine Classes and Weight Ranges Covered by Livestock Risk Protection (LRP)
|
Class |
Lean Weight |
Covered Livestock |
|
Swine |
1.4 – 2.6 cwt. |
All live swine |
|
Unborn Swine |
1.4 – 2.6 cwt. |
Note: Unborn swine are in a separate class. |
Importance of Policy Details
The Livestock Risk Protection program is for producers who want to watch hog markets and pay attention to the details. Keeping a close eye on the market and details of your coverage is vital to maximizing potential benefits. Producers can sign a free application for LRP that does not bind them to any coverage. The application allows the producer the option to have the policy in place even the event they decide to place coverage.
LRP is available for swine at 13, 17, 21, 26, 30-week periods. Unborn swine is available at 30, 34, 39, 43, 47 and 52-week periods. Producers should try to purchase contracts with end dates as near as possible to actual sales date. The period between contract end and swine sale dates puts producers at risk that hog markets can work against them.
One of the benefits of LRP is that it works similarly to the purchase of put options, which are contracts that allow someone to sell an asset at a pre-set price, but without the obligation to sell at that price. This essentially sets a floor on the market price. If market conditions improve and prices rise above the price floor, producers still gain the benefit of a higher sale price in their markets. The only cost incurred is the premium paid for having the insurance. If markets conditions get worse and prices decrease below the price floor, the indemnity payment from LRP helps to offset market losses. This is an example of downside risk protection, where downward price risk is removed and upward price potential still exists.
Note: Put options for hogs provide the same type of downside risk protection but may be more expensive to use and are based on 40,000 pounds of lean hogs. For more information, visit the Chicago Mercantile Exchange (CME) Group website at: https://www.cmegroup.com/markets/agriculture/livestock/lean-hogs.contractSpecs.html
The USDA-RMA publishes a state-specific daily report that is usually available around 4-4:30 p.m. Eastern Time. It can be found at https://www.rma.usda.gov/tools-reports/livestock-reports-lrp-lgm. That report indicates an expected ending value, various coverage levels, the cost per hundredweight of the policy and the end date of the contract.
Figure 1. Example of LRP Livestock Report from USDA RMA dated August 27, 2025.
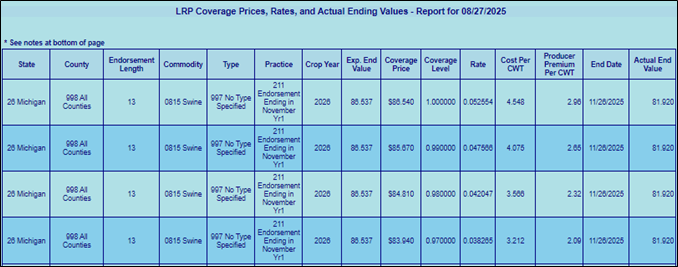
To use LRP, producers need to ensure that insurance agents know they are getting ready to purchase insurance. Unlike crop insurance, RMA reports are published daily during the week in the late afternoon. Once producers decide to purchase insurance, the policy needs to be finalized by 9:25 AM Eastern Standard Time (EST) the following day.
Indemnity (Loss) Payment Calculation
At the end of the contract period, a loss adjuster will review the market and your contract to determine if an indemnity payment is due. An indemnity (loss) payment is made if the actual ending value is less than the coverage price. The payment considers the number of livestock covered in the contract and their target weight. Coverage prices are also compared to actual ending value prices for the period. The formula is:
[(Number of Covered Livestock x Target Lean Weight) x (Coverage Price - Actual Ending Value)] x Insured Share
Note that when there are multiple parties insured under the contract, the producer’s share of the contract will be determined and paid on.
Table 3 provides an example scenario of indemnity payment. In the scenario, a producer took out a 13-week contract on August 27, 2025 (from Figure 1, line 3). The contract has 100 head of livestock with a target weight of 351 pounds (2.6 cwt). The expected market price is $86.537 per cwt. The contract uses a coverage level of 98% with a resulting coverage price of $84.810 per cwt ($86.537 x 98%). An actual ending value was calculated using market reports from November 26, 2025, of $81.92. The producer’s share of the contract is 100%.
Table 2: Example of Indemnity (Loss) Payment for Livestock Risk Protection
|
Number of Covered Livestock |
100 head |
|
Target Weight |
2.6 cwt |
|
Number of Covered Livestock x Target Weight |
100 x 2.6 = 260 |
|
Coverage Price |
$84.810 per cwt |
|
Actual Ending Value |
$81.920 per cwt |
|
Coverage Price – Actual Ending Value |
$84.810 - $81.920 = $2.89 per cwt |
|
Indemnity (Loss) Payment |
260 x $2.89 = $751.40 |
The example in Table 2 outlines how producers utilizing LRP will have market price protection from decreasing hog market prices. The example outlines that a loss payment of $2.89 per cwt ($84.810 - $81.920) was available to the producer due to lower market prices. Multiplied against the total 260 cwt for covered livestock (100 x 2.6) resulted in a payment of $751.40. Because the producer has 100% share of the contract, they also receive the entire indemnity payment after the premium cost is deducted.
Note: It is important to consider the “net pay” calculation of indemnity payments. For the above example, if the premium the producer paid had been $2.32 per cwt multiplied by 260 head of swine, the resulting premium would be $603. If $603 was subtracted from the indemnity of $751, the net benefit to the producer would be $148. See the Premium and Subsidies section of this document for more information.
Record Requirements
To be eligible for indemnity payment, you also have to provide documents that verify the sale of any livestock covered within the insurance period. Information must include:
- The seller’s name, which must match the insured name in the policy.
- The purchaser of livestock.
- The date of sale.
- The number of livestock sold.
- The average weight of the livestock sold.
Note: average weight is not required for unborn livestock. However, documents that verify proof of ownership interest in the animals that any covered livestock were born from are required.
In some cases, additional records may also be required. Visit RMA’s Livestock Insurance Plan website for more information: https://www.rma.usda.gov/policy-procedure/general-policies/livestock-insurance-plans-resources
Livestock Gross Margin
The Livestock Gross Margin program (LGM) focuses on both livestock prices and feed costs. It provides risk protection against falling livestock prices and rising feed costs, or both. However, it does not insure against swine death, unexpected increases in feed use, or even anticipated increases in feed use.
The Estimated gross margin that is covered by the program equals the market value of the livestock minus feed costs. Market value is determined by a formula of market price multiplied by a set yield factor of 0.74, and a set target sales weight of 2.6 cwt or 260 pounds. The lean hog futures prices are used to determine market prices. Similar to LRP, there is no influence from LGM on the prices actually received by producers. Producers are therefore encouraged to market swine to their best advantage.
Feed costs are determined by using a fixed amount of corn bushels and soybean meal pounds. The amount of both commodities used in the calculation are based on a feed ration from Iowa State University. Estimated prices for corn and soybean meal are based on the commodity futures contract months that align with the insurance period.
Feed rations and costs are calculated based on the type of endorsements used within the insurance program. LGM can be purchased for swine using three different types of endorsements:
- Farrow-to-Finish – Feed ration uses 12 bushels of corn and 138.55 pounds of soybean meal.
- Feeder Pig-Finishing – Feed ration uses 9 bushels of corn and 82 pounds of soybean meal.
- Segregated Early Weaned (SEW) – Feed ration uses 9.05 bushels of corn and 91 pounds of soybean meal.
The insurance period is an important consideration for setting LGM contracts. Swine producers are covered for a six-month period after the policy deadline, or sales closing date. For example, an insurance period for a sales closing date in January would include February through July. However, coverage begins the second month of the insurance period. In this example coverage would be March through July. Each month of the insurance period must include the target number of swine you elect to insure (also known as target marketings).
Another important component of the Livestock Gross Margin program is selecting a deductible. A deductible is the portion of the expected gross margin that you choose not to insure. Deductible amounts range from $0 to $20 per head, in $2 increments. The deductible is calculated by multiplying the selected head deductible by the total target number of swine sold across all months in the insurance period. A higher deductible reduces the premium paid but also reduces coverage in the event of a loss.
Indemnity (Loss) Payment Calculation
At the end of the contract period, a loss adjuster will review the market and your contract to determine if an indemnity payment is due. To receive an indemnity payment, the actual gross margin must be less than the gross margin guarantee for the insurance period.
As mentioned above, futures prices and feed costs are used to calculate an expected gross margin or the anticipated difference between the market value of livestock and the cost of inputs (swine and feed). Consider the formula used for a farrow-to-finish operation with sales weight of 260 pounds. A yield factor of 0.74 is used against the expected market price of lean hog futures. Note: pounds are converted to cwt for the formula below:
(2.6 cwt x 0.74 yield factor x Swine Price) – (12 Bushels x Corn Futures Price) – (138.55 pounds / 2,000 pounds per ton x Soybean Meal Futures Price)
After calculating the expected gross margin, the next step is to identify the gross margin guarantee. The gross margin guarantee is the expected total gross margin for an insurance period minus the deductible times the total of target marketings.
Gross Margin Guarantee = (Expected Gross Margin – Deductible) x Total Target Marketings
RMA supplies a listing of expected gross margins each month for both endorsements. Note: expected and actual gross margins, once calculated, are available by accessing RMA’s Actuarial Information at: https://www.rma.usda.gov/tools-reports/actuarial-documents.
To illustrate, consider a farrow-to-finish farm planning to sell 100 head of swine for a price of $84.5 per cwt in February. Using a yield factor of 0.74 and 2.6 cwt per head, the price is estimated at $162.58 per head. The cost of feed is calculated using a price of $4.43 per bushel of corn and $301.10 per ton of soybean meal. Estimated feed costs are $53.16 for corn ($4.43 x 12 bushels) and $20.86 for soybean meal (138.55 / 2,000 pounds per ton x $301.10 per ton) or a total of $74.02. The expected gross margin is $88.56 per head ($162.58 – $74.02). An example of this calculation is shown in Table 3.
Table 3: Example of Expected Gross Margin Calculation for Livestock Gross Margin
|
Estimated Market Price |
$84.50 per cwt |
|
Yield Factor |
0.74 |
|
Weight Per Head (in cwt) |
2.6 cwt (or 260 pounds) |
|
Estimated Gross Revenue |
$84.50 x 0.74 x 2.6 = $162.58 per head |
|
Corn Feed Cost |
$4.43 per bushel x 12 bushels = $53.16 |
|
Soybean Feed Cost |
$301.10 per ton of soybean meal x |
|
Feed Cost |
$53.16 + $20.85 = $74.02 per head |
|
Expected Gross Margin (Revenue – Feed) |
$162.58 – $74.02 = $88.56 per head |
Subtracting a deductible of $10 per head on a 100 head contract, the gross margin guarantee would be calculated as $78.56 per head multiplied by the 100 head in the contract (Table 4 on next page).
Table 4: Example of Gross Margin Guarantee Calculation for Livestock Gross Margin
|
Expected Gross Margin |
$88.56 per head |
|
Deductible |
$10 per head |
|
Gross Margin Guarantee |
$88.56 - $10 = $78.56 |
|
Target Marketings |
100 |
|
Gross Margin Guarantee |
($78.56 - $10) x 100 = $7,856.00 |
The actual gross margin is calculated using the same formula as outlined in Table 3. The difference is that the estimated market prices for lean hogs, corn, and soybean meal are replaced with actual prices.
Table 5 illustrates if the actual gross margin was priced using a lean hog price of $76.90 per cwt. The same formula in Table 3 is used with the actual lean hog price replacing the estimated price. The estimated corn price is replaced with an actual price of $4.64 per bushel. The estimated soybean meal price is replaced with an actual price of $310 per ton.
Table 5: Example of Actual Gross Margin Calculation for Livestock Gross Margin
|
Actual Market Price |
$76.90 per cwt |
|
Yield Factor |
0.74 |
|
Weight Per Head (in cwt) |
2.6 cwt (or 260 pounds) |
|
Actual Gross Revenue |
$76.90 x 0.74 x 2.6 = $147.96 per head |
|
Corn Feed Cost |
$4.64 per bushel x 12 bushels = $55.68 |
|
Soybean Feed Cost |
$310 per ton of soybean meal x |
|
Feed Cost |
$55.68 + 21.48 = 77.16 |
|
Actual Gross Margin (Revenue – Feed) |
$147.96 – $77.16 = $70.80 per head |
Using the same yield factor of 0.74 and 2.6 cwt per head, the actual price is $147.96 per head. The cost of feed is calculated using a price of $4.64 per bushel of corn and $310 per ton of soybean meal. Estimated feed costs are $55.68 for corn ($4.64 x 12 bushels) and $21.48 for soybean meal (138.55 / 2,000 pounds per ton x $310 per ton) or a total of $77.16. The actual gross margin is $70.80 per head ($147.96 – $77.16).
The final step of calculating an indemnity payment is to compare the gross margin guarantee against the actual gross margin. The indemnity payment is calculated as:
Gross Margin Guarantee – Actual Gross Margin = Indemnity Payment (if positive)
As Table 6 outlines, because the actual gross margin was less ($70.80) than the gross margin guarantee ($78.56), the indemnity payment rate is $7.76 per head ($78.56 – $70.80). Multiplied by the 100 head of total target marketings, this results in an indemnity payment of $776.00.
Table 6: Example of Indemnity Payment Calculation for Livestock Gross Margin
|
Gross Margin Guarantee |
$78.56 per head |
|
Actual Gross Margin |
$70.80 per head |
|
Net Difference |
($78.56 – $70.80) = $7.76 per head |
|
Total Target Marketings |
100 head |
|
Indemnity Payment |
$7.76 x 100 = $776.00 |
As the example contract illustrates, the inclusion of feed costs can make determining indemnity payments more complicated. However, the inclusion of costs can also generate additional benefits compared to coverage on market prices alone. Especially when market prices and feed costs move independently of each other and margin losses may be greater. Always consider the risk potential and impact of price directions on margin loss when evaluating insurance programs like Livestock Gross Margin.
Of course, when producers are evaluating risk, the cost of the premium must also be considered.
Record Requirements
The record requirements for Livestock Gross Margin policies are different from some other policies.
The main difference is that you don’t have to provide records up front, but you must retain them for a minimum of three years. USDA may request to examine them or require that they be produced during the retention period. Records include documentation relating to breeding, farrowing, feeding, finishing, and sale of swine. Requests for records can include purchase, feeding, shipment, sale, or other disposition of all insured livestock.
USDA also reserves the right to examine the insured swine during the insurance period.
For more information on record requirements related to swine, review the policy documents at: https://www.rma.usda.gov/policy-procedure/general-policies/livestock-insurance-plans-resources
Premiums & Subsidies
Livestock insurance is not free and requires a premium to be paid for its use. The premium for each type of policy will increase or decrease based on the coverage level you elect.
For example, recall Figure 1 with the report for 13-week long Livestock Risk Protection contracts. Line three at a coverage level of 98.00 % shows that a premium of $2.32 per cwt is paid. Compare that to a higher coverage level of 99.00 % (line two) with a premium of $2.65 per cwt and a lower coverage level of 97.00% (line four) with a premium of $2.09 per cwt.
Figure 1. Example of LRP Livestock Report from USDA RMA dated August 27, 2025
Despite the costs associated with insurance, know that premiums are highly subsidized by the USDA. Therefore, the premium you pay is not the full price for the insurance. These subsidies increase or decrease based on the coverage level you elect as well. Table 6 highlights subsidies associated with Livestock Risk Protection:
Table 6. Subsidy Factors for Swine under Livestock Risk Protection
|
Coverage Level |
75% - 79.99% |
80% - 84.99% |
85% - 89.99% |
90%- 94.99% |
95% - 100% |
|
Subsidy |
55% |
50% |
45% |
40% |
35% |
For Livestock Gross Margin, subsidies are based on the deductible selected for the contract. The higher the deductible being paid, the higher the subsidy applied to the final premium costs. Note: Producers can select or target individual months for coverage. However, to obtain the full subsidy through LGM, coverage must be placed in two calendar months.
For example, if a $0 deductible is chosen, then a subsidy of 18% is received. For a $10 deductible, the subsidy level is 47%. However, if the highest deductible at $20 is chosen, then a subsidy of 50% is received on the premium.
Note: For both LRP and LGM policies, the premium is not due until two months after the selected coverage ends.
Additional Subsidy Support for Beginning Farmers
Beginning farmers receive an additional 10 percentage points of premium subsidy toward existing coverage policy. The percentage points increase the subsidy and reduce the overall premium that the producer pays for the insurance. This applies to all insurance policies that have a subsidized premium through the USDA RMA. USDA RMA defines a beginning farmer as “an individual who has not actively operated and managed a farm or ranch with an insurable interest in a crop or livestock as an owner-operator, landlord, tenant, or sharecropper for more than 10 crop years." For more information visit: https://www.rma.usda.gov/about-crop-insurance/frequently-asked-questions/beginning-farmer-rancher-bfr-veteran-farmer-rancher.
Whole-Farm Revenue Protection
An additional option that can be used on its own or combined with individual insurance policies is a Whole-Farm Revenue Protection (WFRP) plan. It provides coverage for all commodities on a farm under one insurance policy. Designed for farms with up to $17 million in insurable revenue, it covers both crops and livestock. A WFRP plan also covers revenues for farms that are marketed to local, regional, farm-identity preserved, specialty, or direct markets. However, no more than 50% of the total revenue from commodity sales can some from sales of products purchased for resale from other operations.
Record Requirements
You must provide certain documents to ensure eligibility for WFRP insurance. These records include:
- Five consecutive years of Schedule F or other farm tax forms.
- In some cases, supporting information verifying that tax forms have been accurately filed with the Internal Revenue Service.
- If applicable, information supporting that your farm is an expanding operation due to physical expansion in the last year or in an upcoming year. Expansion activities include increased acres, added equipment such as a greenhouse, new varieties or planting patterns, or anything that expands production capacity beyond price changes.
Exceptions to these requirements include:
- First time beginning or veteran farmers may qualify with just three consecutive years of Schedule F, or other tax forms if they’ve farmed in previous years. Note: If you had insurance the previous year and qualified as a beginning farmer or veteran farmer, four years of tax forms are needed.
- Physical inability to farm for one out of five required historic years may qualify if farming a year prior to the insured year.
- You operate as a tax-exempt entity (such as a Tribal entity) and have third-party records available to complete substitute Schedule F tax forms to demonstrate a five-year history.
Calculating the Revenue Guarantee
Farm records are an important part of determining your farm’s approved revenue. An approved revenue is used to determine your amount of insurable revenue based on your historic gross income. The historic gross income is averaged over five years, as reported on Schedule F income tax forms. As of 2020, new provisions reduce impacts on gross income due to losses during your five-year history. For example, a revenue exclusion excludes the lowest year, and the remaining four years are then averaged into an adjusted historic average revenue. The adjusted historic average revenue is compared to expected revenues for an upcoming crop year. Whichever of these two revenue numbers is lower becomes the approved revenue. Another option is a revenue substitution that replaces a poor revenue year with 60% of your simple average allowable revenue based on your five-year history. A final option is a revenue cup, which establishes that revenue cannot fall below 90% of the previous year’s approved revenue. Your crop insurance agent will assess each of these and let you know which is most advantageous for you.
Note: Expected revenues must be based on allowed revenue streams. Examples of nonallowable revenue streams include custom-hired agricultural work, contract growing, government program payments (such as Conservation Reserve Program participation), and post-production processing.
The insured revenue is calculated by multiplying your approved revenue by your coverage level:
Approved Revenue x Coverage Level (%) = Insured Revenue
Coverage levels range from 50% to 85%, similar to other insurance policies (see Table 7). Revenue coverage amounts are limited to a maximum of $17 million. Coverage of revenue from greenhouses or nurseries is limited to $2 million, with an exception noted for aquaculture related commodities.
Table 7: Maximum Farm Approved Revenue at Each Coverage Level
|
Coverage level |
Commodity count (Minimum required) |
Maximum farm approved revenue (MFAR) |
Maximum insurable revenue |
|
85 |
1 |
$20,000,000 |
$17 million |
|
80 |
1 |
$21,250,000 |
$17 million |
|
75 |
1 |
$22,666,667 |
$17 million |
|
70 |
1 |
$24,285,814 |
$17 million |
|
65 |
1 |
$26,153,846 |
$17 million |
|
60 |
1 |
$28,333,333 |
$17 million |
|
55 |
1 |
$30,909,091 |
$17 million |
|
50 |
1 |
$34,000,000 |
$17 million |
Farms with two or more commodities automatically receive a whole-farm subsidy, while farms with only one commodity receive an enterprise subsidy.
Indemnity (Loss) Payment Calculation
At the end of the season, after you have filed your farm income taxes, a loss adjuster will review your records. The adjuster will look for allowable revenue and expenses, inventory adjustments, unharvested or unsold production, and production lost from causes not covered by the program. The adjuster will use your farm records to determine an actual total farm revenue. A loss indemnity payment is made when your farm’s actual total revenue falls below the insured revenue.
Revenue Guarantee – Actual Revenue = Indemnity Payment (if positive)
Micro Farm Program
A Micro Farm Program (MFP) is similar to a WFRP plan. It also provides coverage for all commodities on a farm under one insurance policy, including both crops and livestock. No more than 50% of total revenue from commodities can come from product purchased from other operations for resale by your operation. MFP policies cover revenues for farm products marketed to local, regional, farm-identity preserved, specialty, or direct markets. Farmers can drop their lowest year out of five for purposes of revenue calculation.
A key difference for an MFP policy is that it is designed for farms with up to $350,000 in insurable revenue. The insurable revenue increases to $400,000 if you held a policy in the previous year.
Additional Differences from Whole-Farm Revenue Protection
Additional differences exist with an MFP compared to a WFRP policy. Those differences include:
- A minimum of only three consecutive years of Schedule F, or farm tax forms, are needed to determine an approved revenue.
- Beginning or veteran farmers/ranchers can use another person’s tax records when purchasing or inheriting a farm operation, provided they have materially participated in the operation or management of that farm.
- If your farm has been expanding over time, approved revenue may be allowed to increase. Five consecutive years of revenue history and measurements of growth are needed to verify expansion.
- A WFRP policy uses an individual farm’s prices to value its commodities. In an MFP policy, the total value for all your commodities will be calculated for your farm.
- Value-added product sales are insurable revenue for MFP, unlike WFRP where they are excluded.
Indemnity (Loss) Payment Calculation
Indemnity payments are also handled similarly to a WFRP policy. At the end of the season, a loss adjuster will review your records. The adjuster will use your farm records to determine an actual total farm revenue. A loss indemnity payment is made when your farm’s actual total revenue falls below the insured revenue.
Revenue Guarantee – Actual Revenue = Indemnity Payment (if positive)
Final Thoughts & Recommendations
In addition to the policy options outlined in this publication, there are also private nonsubsidized (peril) policies on the market. The cost versus the benefit of these policies varies widely, but an insurance agent can help guide the decision of what is best for each individual farm.
Producers can purchase livestock market protection policies from insurance agents in a similar manner to buying crop insurance. Agents selling crop insurance frequently sell livestock policies.
Michigan State University Extension recommends visiting with an insurance agent to discuss the policy options and risk scenarios that exist for your farm operation. Due to the number of details and options within insurance policies, deciding what to do can become complicated. A strong working relationship with your agent can be helpful when it comes to record keeping, program analysis, and program rollout notifications. Agents can provide specific details on eligibility, timelines, and documentation requirements for policies and options of interest.
To visit with a crop insurance agent, use the Agent Locator Page offered through the USDA’s RMA (https://www.rma.usda.gov/tools-reports/agent-locator).