

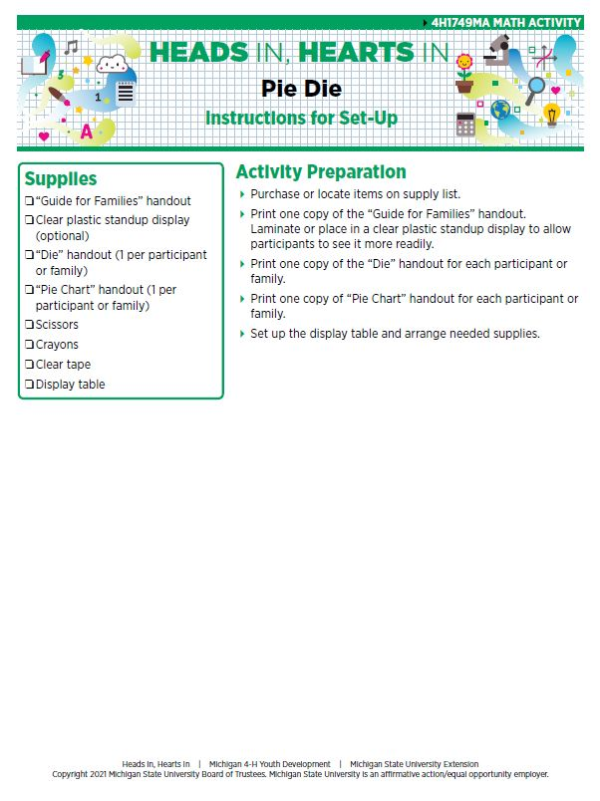
Heads In, Hearts In: Pie Die
DOWNLOADMay 25, 2021 - MSU Extension
 Print
Print Email
EmailWhat you need to know:
A graph is a way to show numbers in a chart or picture. A pie chart is a way to show information in a picture with a circle divided into sections to represent different parts of a whole.
What you will do and learn:
This activity will help you practice counting and grouping items and then displaying or graphing your results. In this activity, you will roll a die to collect information and total how many different colors you roll. You will then use a pie chart to display the results.
Other Documents in this Series
You Might Also Be Interested In
-
Helping Create A Solid Foundation For Children
Published on August 6, 2024
-
Heads In, Hearts In: A Tube Rube
Published on June 20, 2022
-
Heads In, Hearts In: The Strongest Column
Published on June 20, 2022
-
Heads In, Hearts In: Rockin’ Roller Coaster
Published on June 20, 2022
-
Heads In, Hearts In: Pulley Power
Published on June 20, 2022
-
Heads In, Hearts In: Peanut Hut
Published on June 20, 2022


Accessibility Questions:
For questions about accessibility and/or if you need additional accommodations for a specific document, please send an email to ANR Communications & Marketing at anrcommunications@anr.msu.edu.