Evaluating nitrogen rates for corn with high fertilizer prices
 Print
Print Email
EmailMaximizing profitability begins with optimizing nitrogen’s return on investment.
In late February 2026, passage through the Strait of Hormuz was nearly impossible due to the ongoing conflict between the United States and Iran. The strait is a major throughway in the Middle East for global exports of crude oil, natural gas and nitrogen fertilizers. Approximately 50% of global exports of Urea and sulfur and 20% of global exports of natural gas pass through the Strait of Hormuz. Natural gas is a key ingredient for manufacturing anhydrous ammonia which is a basic building block for many nitrogen fertilizers. With global exports reduced, supply concerns have led to a significant increase in nitrogen fertilizer prices.
Reports from USDA’s Agricultural Marketing Service (AMS) indicate that price per ton on nitrogen products have increased between 12.41% to 41.48% in the past month (Table 1). The price increase has put consideration pressure on buying decisions as farms finalize planting intentions and crop needs. Especially for farms who may not have purchased inputs in the fall due to tax strategies or limited available cash.
|
Table 1. Percent Change in Nitrogen Prices Between February and March 2026 |
||||
|
2/20/2026 |
3/20/2026 |
% change |
$ Increase/ton |
|
|
NH4 |
$843.00/ton |
$998.00/ton |
18.39% |
$155.00 |
|
UAN |
$435.00/ton |
$489.00/ton |
12.41% |
$54.00 |
|
Urea |
$581.00/ton |
$822.00/ton |
41.48% |
$241.00 |
Based on Illinois Production Cost Reports from USDA Agricultural Marketing Service (AMS)
Table 1 outlines the changes in nitrogen products of Anhydrous Ammonia (NH4), Urea Ammonium Nitrate (UAN), and Urea. Of the three nitrogen products, Urea has had the most significant change in pricing with an increase of 41.48%. Price increases are due to a combination of supply reductions in both the actual fertilizer and a major ingredient (natural gas) used to manufacture additional supplies.
To better understand the impact of these price changes, nitrogen fertilizer prices are often compared to the price of corn.
Nitrogen to Corn Price Ratio
The Nitrogen to Corn Price Ratio (N:Corn Price Ratio) helps to identify how much of a bushel of corn is needed to cover the price of fertilizer. A higher price ratio indicates that more of each bushel of corn is required to cover fertilizer costs.
The N:Corn Price Ratio is calculated as:
Nitrogen Price ($) per Pound ÷ Corn Price ($) per Bushel
The relationship to the two sets of prices is important when using the ratio to make decisions. Over the past several years, nitrogen and corn prices have shifted dramatically. In some years, both sets of prices have seen parallel increases or decreases, resulting in a lower or more consistent price ratio. In recent years, nitrogen and corn have moved in opposite directions to each other. Specifically, fertilizer prices have increased while commodity prices have decreased. The result is the price ratios seen in Figure 1.
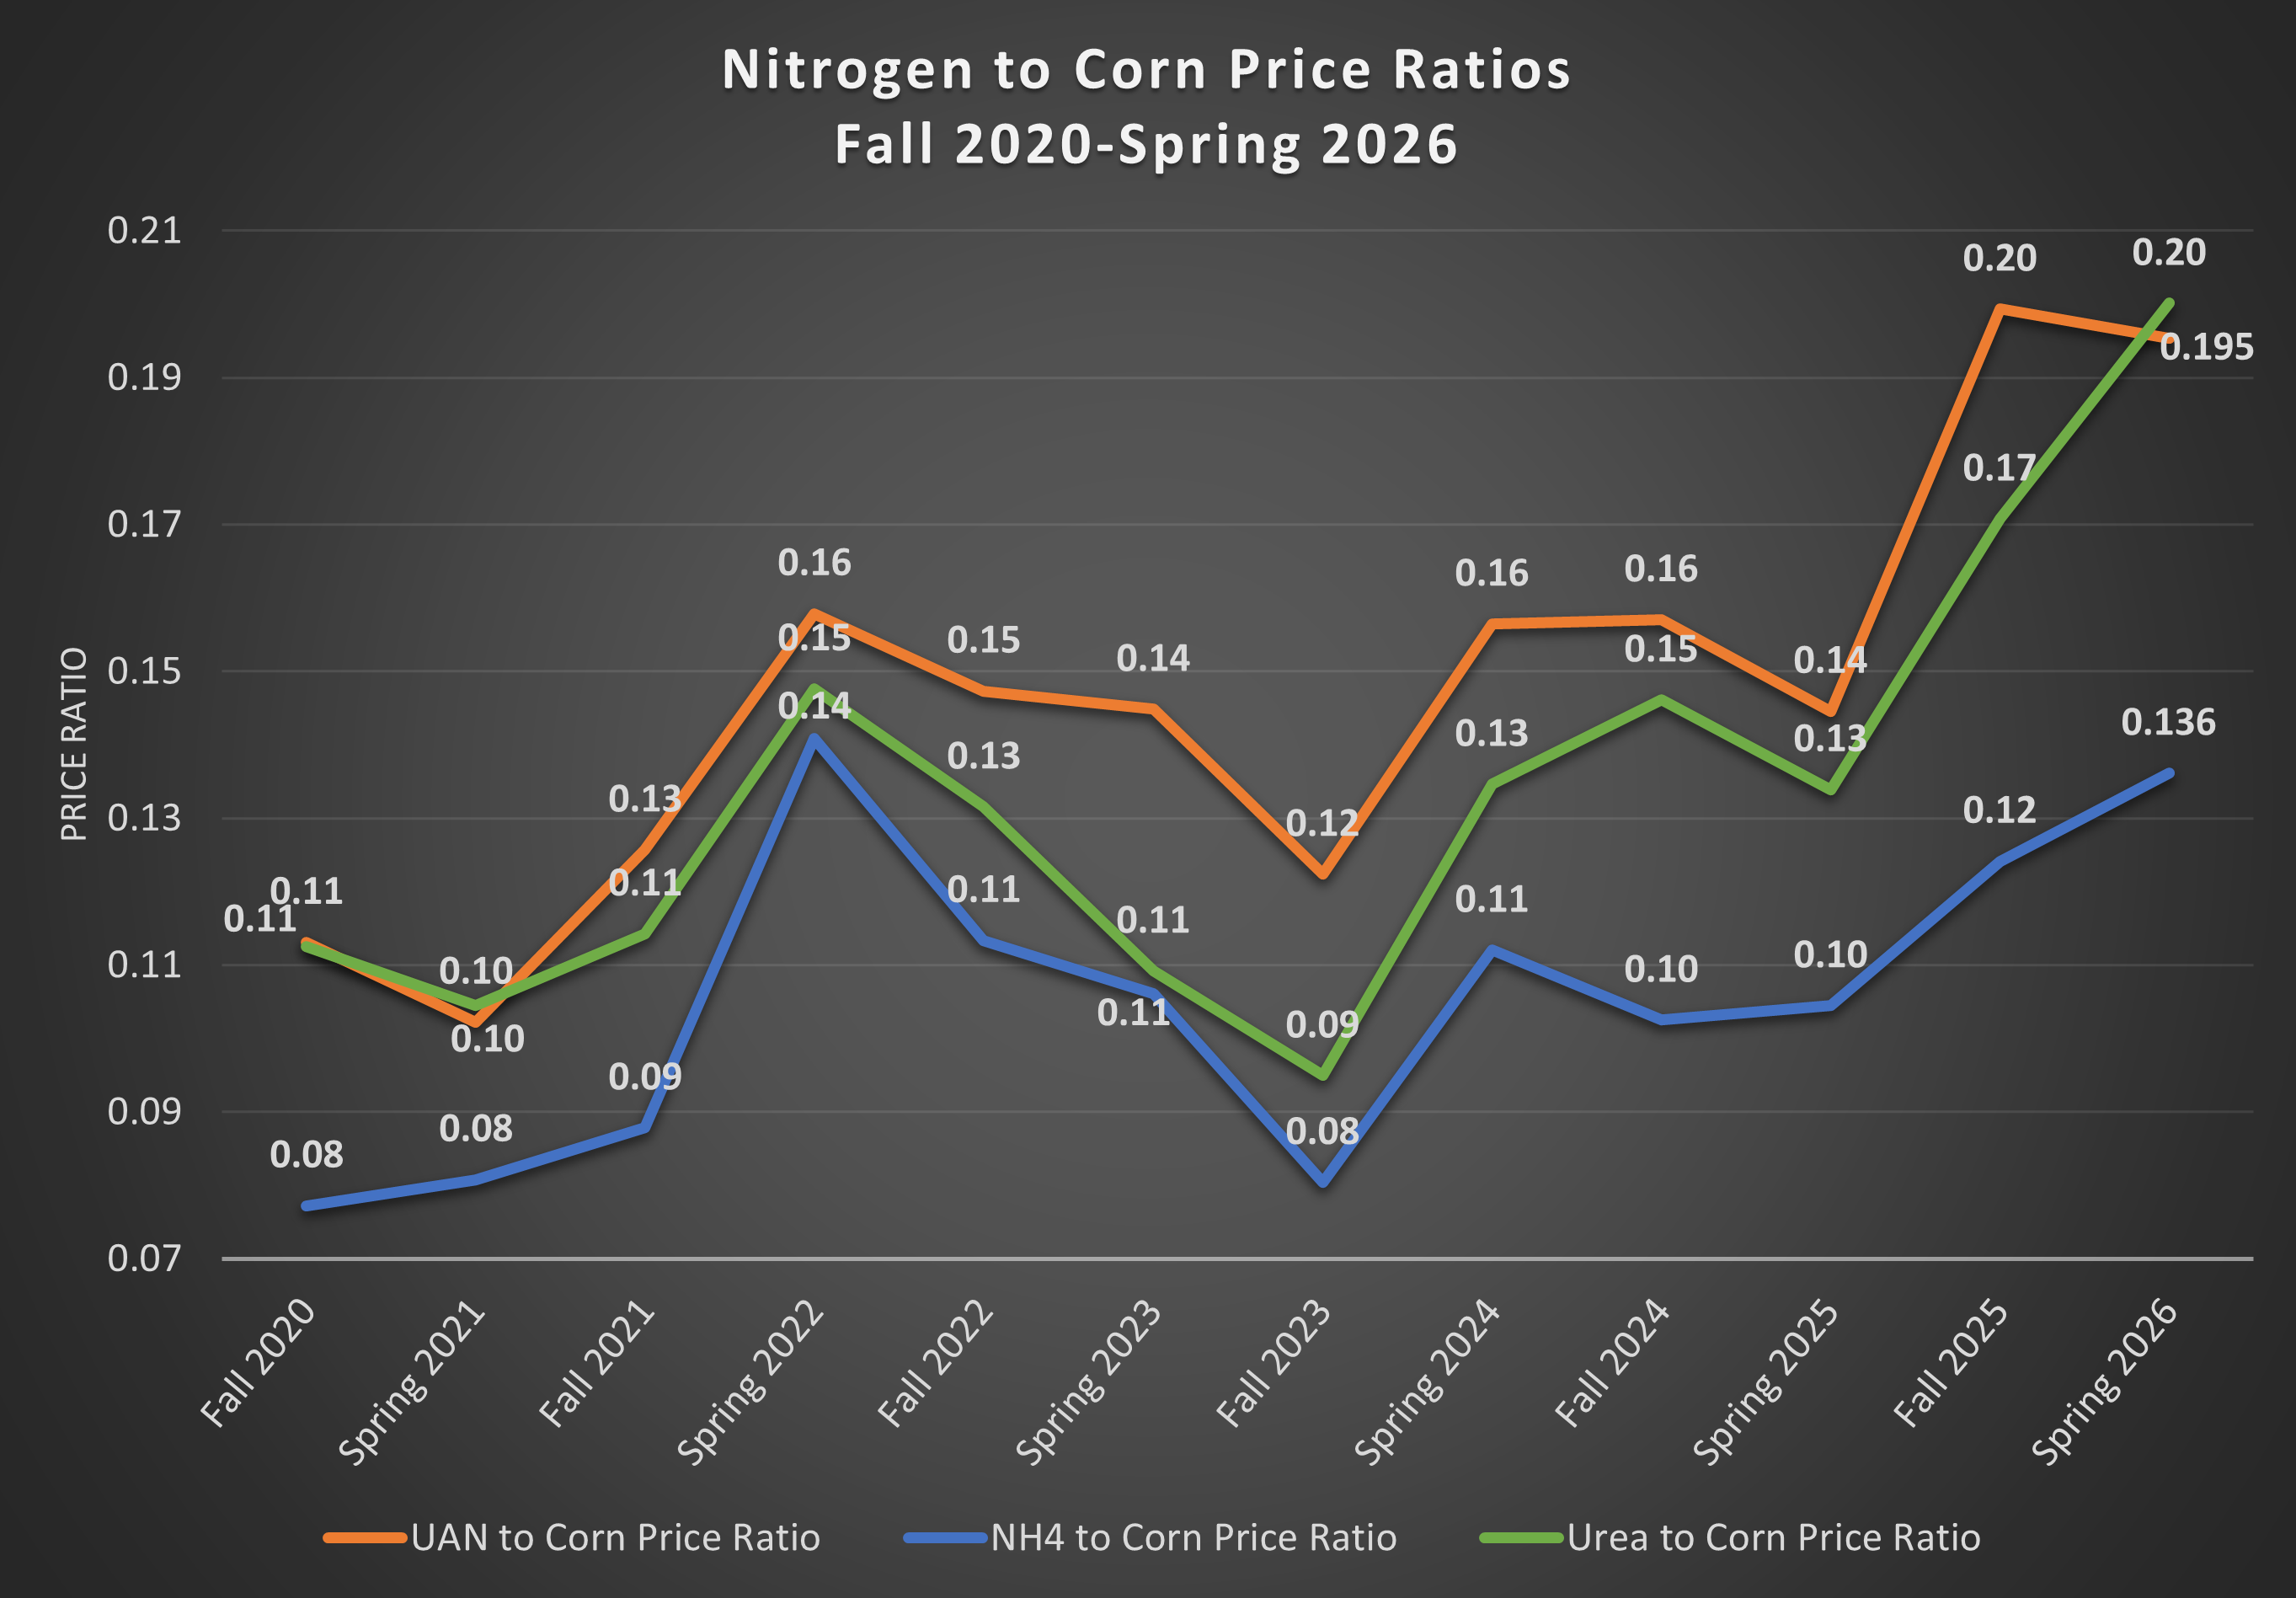
Figure 1 outlines that price ratios for each nitrogen product initially peaked in the spring of 2022. These increases were due to a combination of factors including supply disruptions in the Black Sea region, hurricanes impacting key ports and transportation routes and COVID-related production and distribution issues. During this period, the same supply disruptions to impacted fertilizer also led to almost record commodity prices, including corn. Although price ratios were elevated in this period, corn prices helped to offset much of the impact higher nitrogen prices could have had. UAN reached a price ratio of 0.16, Urea had a price ratio of 0.15, and NH4 closely followed at a ratio of 0.14.
Corn and nitrogen prices eventually decreased in 2024. Since then, corn has fluctuated about $0.50 per bushel between spring and fall. Nitrogen prices had been fairly steady until the spring of 2025 when tariffs, energy costs, and supply limitations began to increase prices. These increases continued into the fall of 2025, resulting in N:Corn Price Ratios at the highest levels seen in the past five years for UAN (0.20) and Urea (0.17). NH4 (0.12) remained slightly lower than the 2022 peak ratio.
Many of the factors impacting nitrogen prices were still in effect when the Strait of Hormuz became functionally impassible. The impact on nitrogen prices has been a rapid increase to levels last seen in the spring of 2022. While corn prices are slightly higher now than they were in the fall, they are still well below prices seen in 2022 and are unable to offset nitrogen price increases. The N:Corn Price Ratio for Urea (0.20) is now at a record high for the past six years. While the ratios for NH4 (0.136) and UAN (0.195) are the second highest seen in the past six years.
Even if the Strait of Hormuz could be safely navigated right now, many economists project it will take several months before supply lines return to normal. This means that the higher nitrogen price environment will likely last into nitrogen side-dress periods. A helpful tool, tailor made for these price environments is the Maximum Return to Nitrogen (MRTN) calculation.
Maximum Return to Nitrogen (MRTN) and the N:Corn Price Ratio
The MRTN is first and foremost a production-based tool. It identifies the optimum yield response to nitrogen applications called the nitrogen response curve. The nitrogen response curve identifies the point where an additional application of nitrogen does not produce any additional yield increase. The response curve is based on nitrogen response trial data and NOT based on the N:Corn Price Ratio.
The calculation then considers the economic optimum nitrogen rate (EONR). The EONR is the nitrogen rate where the last unit of N returns a yield increase large enough to cover the cost to pay for that N. The price per bushel of corn and the price per pound of nitrogen are important considerations in identifying the EONR. The inclusion of prices in the EONR links it to the N:Corn Price Ratio. The key additional factors are yield potential, rotation, and soil productivity potential to determine an optimal N rate.
The MRTN calculation then identifies a return to nitrogen, or the actual dollars of income for the nitrogen investment. Finally, the maximum return to nitrogen (MRTN) is determined as the nitrogen rate that achieves the most profitable yield given corn and nitrogen prices. For more information on the MRTN calculation, visit the Corn Nitrogen Rate Calculator.
Bulletin 974: Tri-State Fertilizer Recommendations makes use of the MRTN calculation in its nitrogen rate recommendations. Table 7 within the bulletin outlines suggested nitrogen rates for corn grown in Michigan. Based on the N:Corn Price Ratio, suggested nitrogen rates are adjusted based on MRTN calculations. An updated chart (Figure 2) is also provided at Michigan State University’s Soil Fertility & Nutrient Management website at soil.msu.edu.
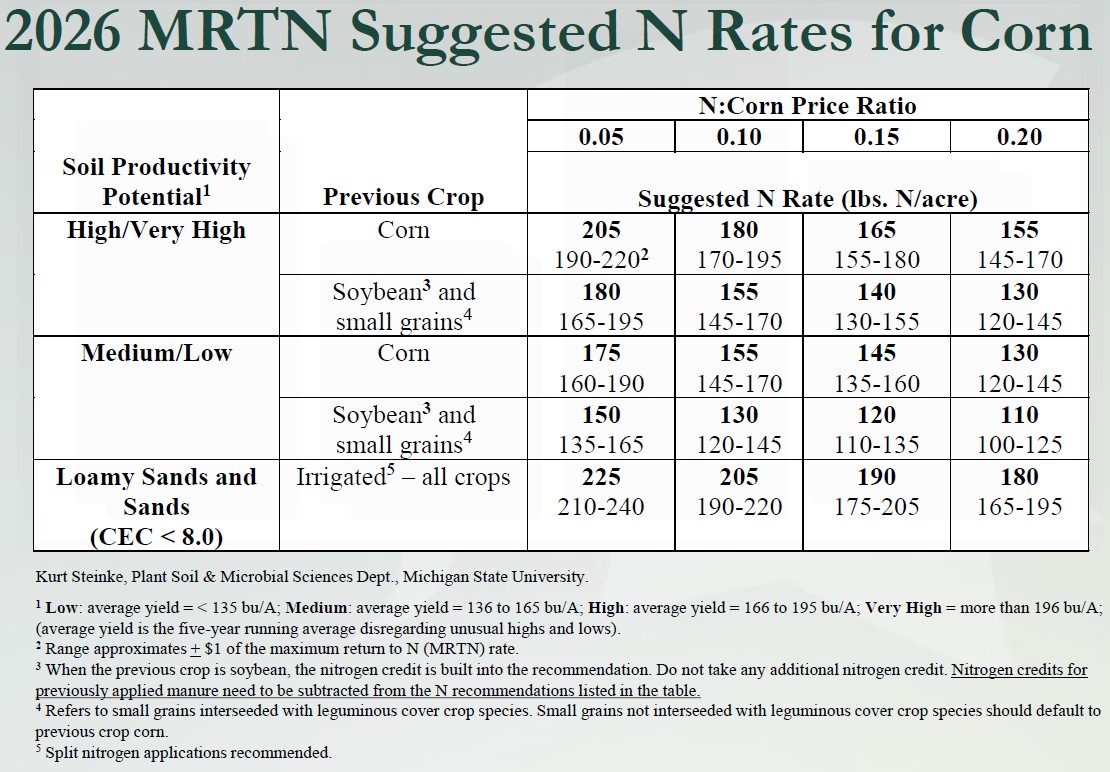
The MRTN suggested rates in Figure 2 provide guidance on the amount of nitrogen to apply when considering nitrogen prices relative to corn prices. Comparing the recommended nitrogen rates against the N:Corn Price Ratios seen in Figure 1, lower rates of nitrogen application are suggested.
For example, consider a field that has medium soil productivity potential with soybeans planted in the previous year. Potential yields would be between 136 to 165 bushels per acre. Figure 1 indicates a N: Corn Price Ratio of 0.20 for Urea and 0.195 for UAN. The chart in Figure 2 recommends a MRTN rate of 110 pounds of nitrogen per acre. To achieve the target nitrogen rate, 239 pounds of Urea or 37 gallons of UAN (28%) would need to be applied.
Due to different price points, actual MRTN rates may vary based on the nitrogen product being applied. For best results, use the Corn Nitrogen Rate Calculator and your farm’s main source for nitrogen to identify a target rate for your farm.
With higher nitrogen prices, it’s important to consider that maximizing yield does not necessarily mean higher profits. While higher yields may be achievable, those yields need to provide a return on the inputs invested in them. In an environment of high nitrogen prices and low corn prices, the N:Corn Price Ratio can be a helpful tool to maximize nitrogen returns. Producers are encouraged to review the N:Corn Price Ratio and their farm’s yield potential as they finalize crop plans.