Using key performance indicators on your dairy farm
 Print
Print Email
EmailKey performance indicators can help you set and achieve measurable goals on your farm
Producing high-quality milk doesn’t just happen by accident. On a dairy farm, producing high quality milk is a critical component of farm success and profitability. To do this, farms must have a system for setting goals and assessing performance. One way to do this is by using key performance indicators (KPIs), which are quantifiable measurements used to track a business’ performance towards its goals. I recently released a video series on this topic on my YouTube channel, Top Milk Quality. The videos describe the process of developing KPIs as well as some realistic goals for farms to implement relating to milk quality.
Watch the YouTube series: Using Key Performance Indicators to Manage Udder Health.
Creating a management plan
To create a plan for continual improvement, farms must first create a management plan. Finding time to set and measure goals can be especially challenging on dairy farms, as farms are often short staffed and farm stakeholders can be busy simply running the day-to-day operations. However, scheduling time on a quarterly basis to evaluate a farm’s performance is critical to creating a management plan specific to the farm.
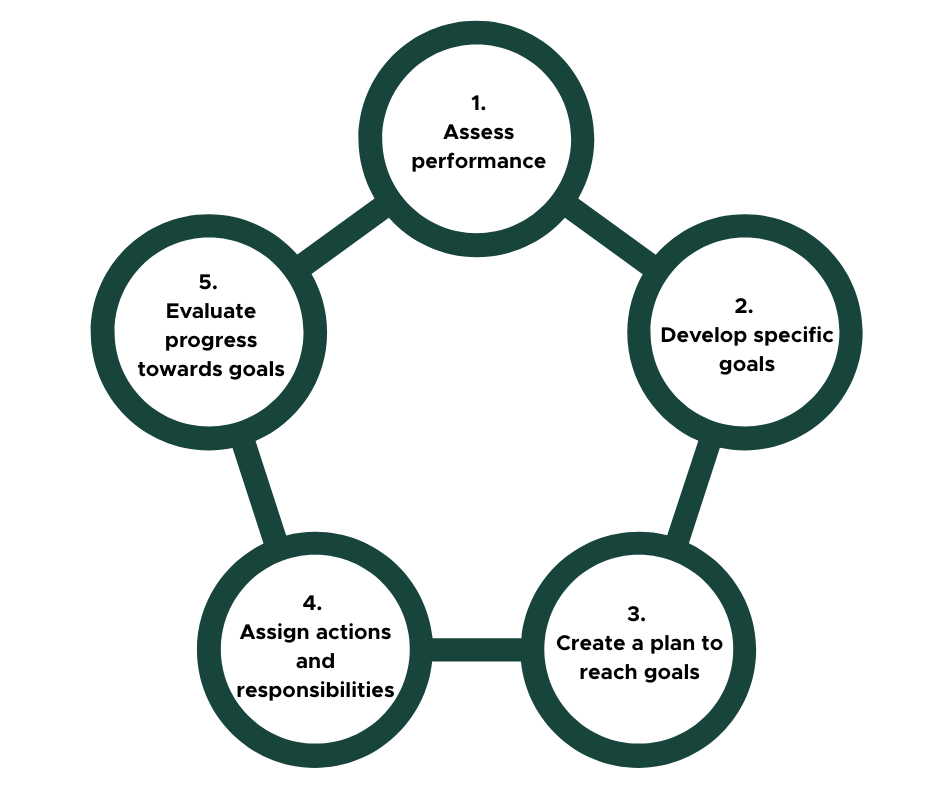
The five aspects listed below are part of the management cycle, in which key stakeholders continually plan, monitor, develop and evaluate progress towards specific and measurable goals.
Bulk tank somatic cell count (BTSCC) key performance indicators
The bulk tank somatic cell count measures the quality of the milk sold from a farm, but it doesn’t contain the milk from all the cows on a farm. Only cows that are healthy enough can contribute milk. Cows with abnormal milk, those with mastitis, or those treated with antibiotics for other reasons do not contribute milk to the bulk tank.
The bulk tank somatic cell count indicates if subclinical mastitis is becoming a problem in a herd. Over the years, guidelines for an acceptable BTSCC have become more stringent. The current goal of less than 200,000 cells per milliliter (mL) is realistic for most farms. When the BTSCC increases, it is likely because more animals in the herd have subclinical mastitis. When a cow has clinical mastitis and abnormal milk, that milk does not go in the bulk tank and does not contribute to an increased bulk tank somatic cell count.
Another factor that affects the bulk tank somatic cell count is the number of cows that have subclinical mastitis in a chronic manner. This means that for two or more months, a cow has a somatic cell count over 200,000 cells per mL. If the BTSCC is increasing on a farm, it is important to review individual cow monthly cell count data to identify these chronically infected cows.
The goal is for farms to have a bulk tank somatic cell count below 200,000 cells per mL.
Subclinical mastitis key performance indicators
Cows with subclinical mastitis have an excess number of somatic, or inflammatory cells, in the milk due to the presence of bacteria in the udder. Even when the milk, the udder, and the cow appear normal, they can have an elevated somatic cell count. Monthly somatic cell counts are the best practice for evaluating subclinical mastitis in a herd. With these numbers, you can calculate these three key performance indicators.
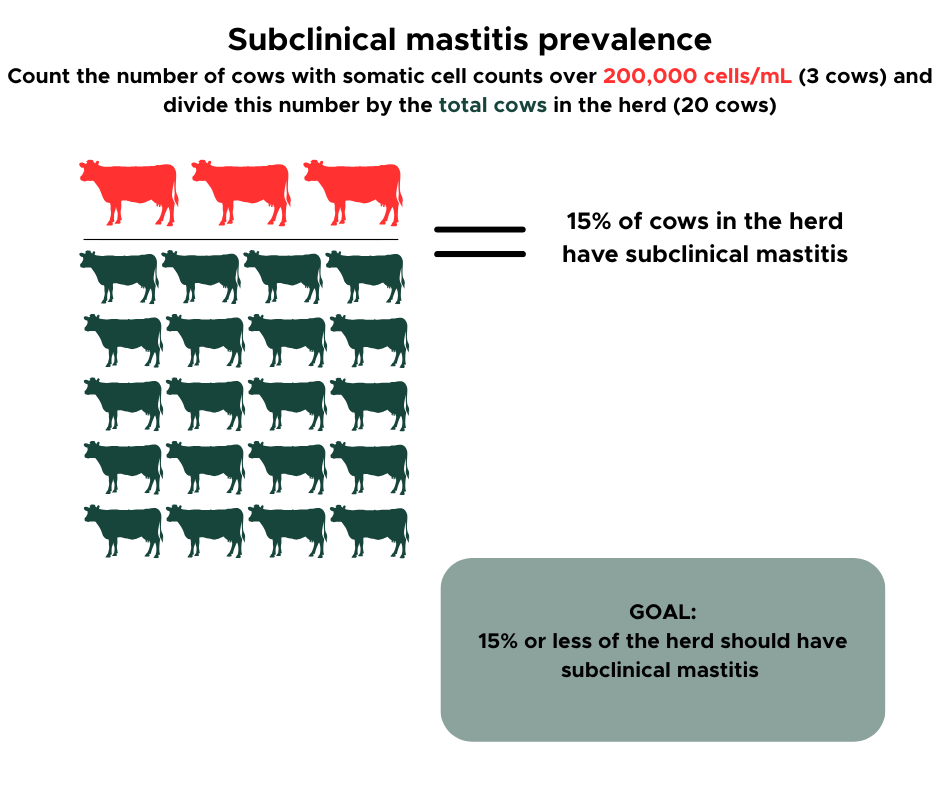
- Prevalence. Count the number of cows that have somatic cell counts over 200,000 cells per mL and divide that by total cows in the herd. This indicates how many cows have subclinical mastitis that month.
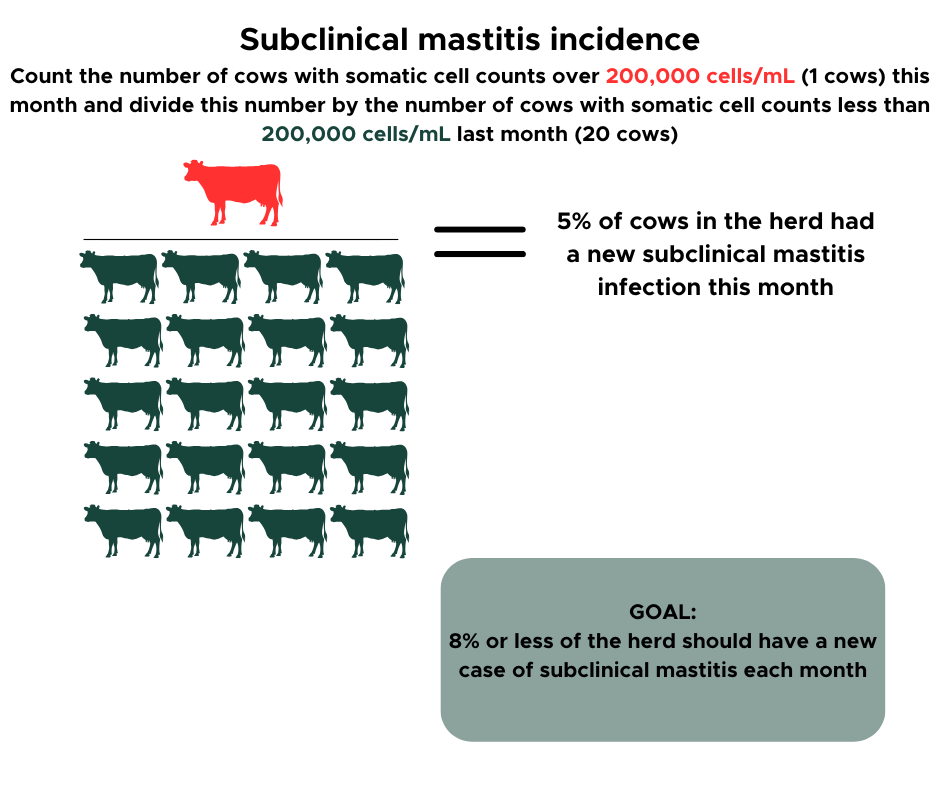
- Incidence. Farms need two months of somatic cell counts to calculate incidence. Count the number of cows that have over 200,000 cells per mL this month and divide by the number of cows that had less than 200,000 cells per mL last month. This indicates how many new subclinical mastitis infections occurred this month.
- Dry off and fresh cow program quality. Count the cows in their first month of lactation that have a somatic cell count over 200,000 cells per mL and divide by all cows with somatic cell counts in their first month of lactation. This identifies how many fresh cows have subclinical mastitis at the beginning of lactation.
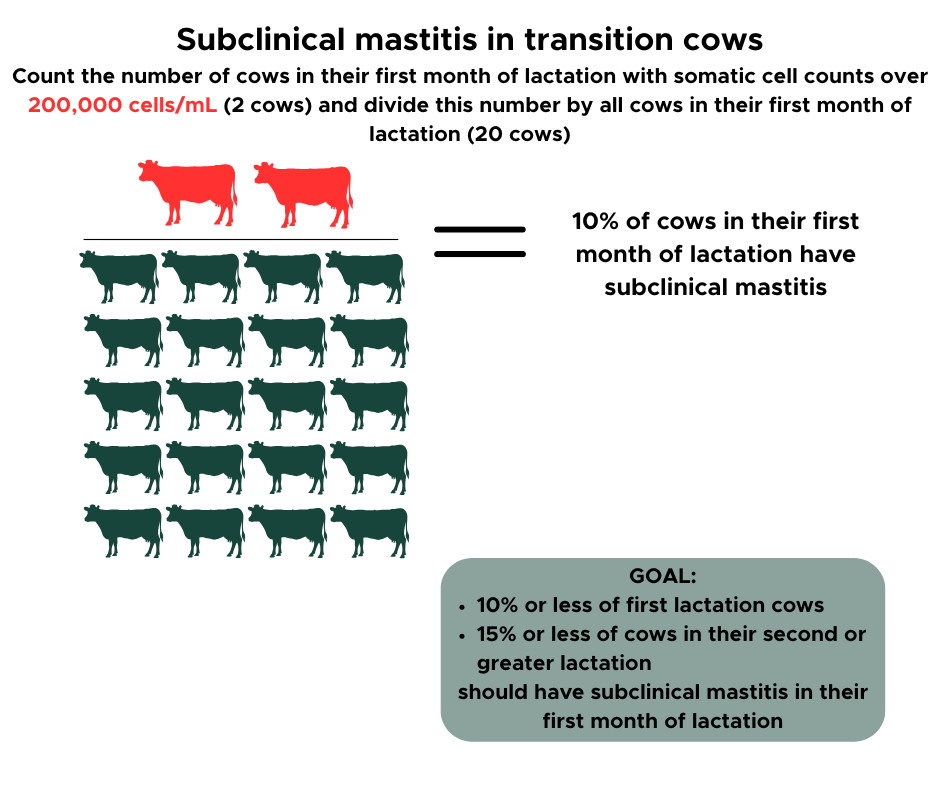
The goals are to aim for a prevalence rate of 15% or less and an incidence rate of 8% or less for subclinical mastitis. Consider the number of lactations to assess fresh cows: 10% or less of cows in their first lactation and 15% or less of cows in their second or greater lactation should have subclinical mastitis in their first month of lactation.