2026 Corn Projected Cost of Production
DOWNLOADApril 10, 2026 - Jonathan LaPorte
 Print
Print Email
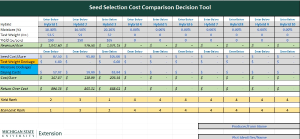
EmailFarm profitability is a bottom-line priority for farmers. It is a challenge in any year, but particularly in times when input costs are on the rise and grain prices are flat or falling. When margins are tight, farmers need to know their cost of production to determine what inputs and practices are profitable and which ones may need to be put on hold. The new MSU Extension 2026 Projected Cost of Production tool for Corn is intended to serve as a starting point for discussions on both expected income and expenses for individual farms.
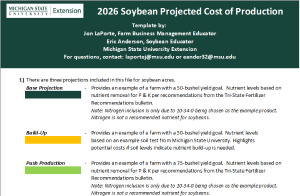
There are three versions of the cost of production tool for non-irrigated and irrigated corn acres included in a single downloadable Excel file:
- The Base Projection version provides an estimate for farms seeking to minimize costs without sacrificing yield. The non-irrigated base projection uses a yield goal of 165 bushels per acre, and the irrigated base projection uses 215 bushels per acre. Both base projections have aligning chemical plans and assume fertility plans based on rate of nutrient removal from the Tri-State Fertilizer Recommendations bulletin.
- The Build-Up versions for non-irrigated and irrigated corn start out using the same information as the base projections. The fertility plans are updated to include recommended additional fertilizer inputs to build up soil nutrient levels based on sample soil test results.
- The Push Production versions provide an estimate for farms seeking to push maximum yield output. The non-irrigated push production uses a yield goal of 195 bushels per acre, and the irrigated push production uses 240 bushels per acre. Both projections have aligning chemical plans and assume fertility plans based on rate of nutrient removal from the Tri-State Fertilizer Recommendations bulletin.
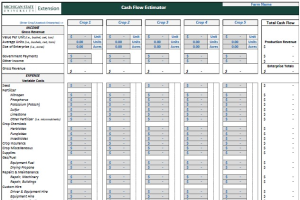
Income values are derived from price projections from composite grain buyers across Michigan and yield data for Michigan from USDA’s National Agricultural Statistics Service (NASS). Expenses are based on the latest Illinois production costs report from USDA’s Agricultural Marketing Service (AMS), compositive prices from Michigan retailers, five-year average benchmark data from the FINBIN database (finbin.umn.edu), and current price trends. The example expenses are based on recommendations from various resources at Michigan State University. Resources include:
- MSU Weed Control Guide
- Tri-State Fertility Recommendations & supplemental data from msu.edu
- Crop Protection Network
Note: products used in the examples are for illustrative purposes only and not considered an endorsement by Michigan State University.
At the time of publishing, the Non-Irrigated Base Projection budget estimates a break-even price of $4.60 per bushel or a break-even yield of 174.33 bushels per acre. The Irrigated Base Projection budget estimates a break-even price of $4.93 per bushel or a break-even yield of 243.65 bushels per acre. Individual farm values and break-even values will differ based on production practices, timing of purchases, and/or value of corn at time of sale. All versions of the tools can be edited by individual farms to create budgets for their own operations.
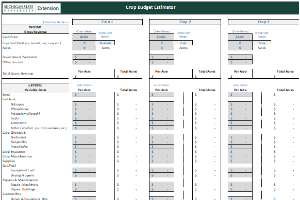
All versions of the tool can be edited by individual farms to create budgets for their own operations. All version are also printable in a PDF format, as shown in the example 2026 Corn Non-Irrigated Cost of Production Projection and 2026 Irrigated Corn Cost of Production Projection handouts.