Growing Degree Day Information

Information on degree days for tree pest management has been compiled based on a pest of interest. For more information, follow the link to the article below.
- Read about using growing degree days.
- Forecast important life stages or specific landscape insect pests or conifer insect pests with typical degree day accumulations in your area.
- List of the growing degree day maps in numerical order.
- Michigan map with county borders for reference in locating your farm on the degree day maps.
Degree day accumulation maps for improving timing of insect pest management
Nathan W. Siegert, Entomology
Deborah G. McCullough, Entomology and Forestry
Jeffrey A. Andresen, Geography
Insect pest management is an important aspect of Christmas tree production. Growers must routinely scout fields to determine if damaging insect pests are present and, if so, decide whether controls are needed. When an insecticide application or other type of control is warranted, it must be applied at the appropriate time to ensure that the treatment will be effective. Correctly timing activities, such as scouting or pesticide applications, can be challenging because of variation in weather among years and among locations. For example, insect development can be two to three weeks faster in a year with warm, sunny spring weather than in a year with cold, wet spring weather. Similarly, insect development may begin several days earlier in southern lower Michigan than in northern Michigan or the Upper Peninsula.
Many Christmas tree growers and farmers know that “degree days” can be a useful tool to help time pest survey and control activities. “Degree days” is a term that refers to the accumulation of heat units above a threshold temperature over time. In other words, it is a convenient measure of how warm or cold it has been during the spring and summer. Monitoring degree day accumulation in your specific area can help you estimate when specific insect pests are likely to be present. In the North Central region, we typically use 50 °F as a threshold (also referred to as a base temperature) for degree day accumulation. Because insects are cold-blooded animals, temperatures usually must be relatively warm before feeding, flight, egg hatch or other important activities can occur. Development of immature insects is especially affected by temperature. In spring, weather warms up and temperatures often begin to exceed 50 °F for at least a few hours during the day. As spring progresses and it continues to get warmer, temperatures exceed 50 °F for an increasing portion of the day. In its simplest form, one degree day represents an accumulation of 24 hours of temperatures above 50 °F. By the end of summer, more than 1200 degree days may accumulate in northern areas of the North Central region, while 2000 degree days or more may accumulate in the southern portion of this region.
If we intensively monitor a local population of an insect over time, and if weather data are available for that particular area, we can identify the degree day accumulation associated with significant events in the life cycle of the insect. Entomologists have collected this information for many common or economically important species of insects. Agricultural meteorologists from most land grant universities monitor weather throughout the growing season and provide up-to-date degree day accumulation data for many areas of their state, typically on extension or agricultural web sites and publications. Growers can successfully improve the timing of their pest scouting, pesticide applications and similar activities by using degree day accumulation rather than relying on calendar dates.
We compiled a list of economically important insect pests that affect forest trees, Christmas trees and ornamental trees, then acquired the degree day accumulations associated with significant events in the life cycle of each pest. Degree day values included in the list represent our field observations, research or publications written by other experienced entomologists.
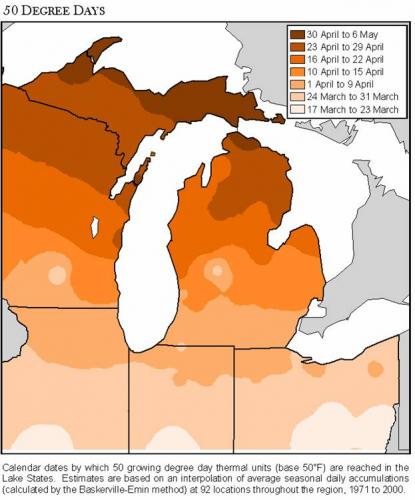
In addition, we generated maps of average seasonal degree day accumulations for the region. We did this by acquiring the daily weather records of maximum and minimum air temperature collected from 1971-2000 (30 years) at 92 weather stations in Michigan and the surrounding North Central states of Wisconsin, Illinois, Indiana and Ohio (Midwestern Regional Climate Center, 2005). Weather stations were selected based on the reliability of their long-term weather data and their relative location to ensure adequate representation of the climatic variability of the region. Using these daily weather records, we calculated the average seasonal accumulation of growing degree day thermal units over the 30-year period for each location. We calculated our degree day accumulations using the Baskerville-Emin method with a base temperature of 50 °F. The geographically-referenced Julian dates of degree day accumulations for each location were exported to the ArcView 3.2 geographic information system (Environmental Systems Research Institute [ESRI], Redlands, CA). Isoclines were generated using the ArcView Spatial Analyst extension (ESRI). Separate GIS contour maps were generated for the average seasonal accumulations of 50 to 2000 degree days (base 50 °F) throughout the region, at 50 degree day intervals. An example of the GIS map representing the average accumulation of 50 degree days (base 50) is shown below.

Fig 1. Example of a map showing the accumulation of 50 degree days (base 50°F) by location in Michigan and surrounding states. Mapping was based on 30-year average temperatures recorded at 92 different weather stations across the illustrated region.
See Table 1 for a list of insect pests of Christmas trees and the respective degree day accumulations associated with specific life cycle events for individual species. Find the pest of interest and click on the link for the appropriate degree day map. Simply find the location of your field or property and use the legend to determine when that degree day accumulation is likely to occur. Note that the maps are based on average climatic values over a 30-year period. Occasionally, very unusual weather patterns or microclimate situations may occur and insect development may fall outside the expected window of time. These maps will be a useful tool for Christmas tree growers and farmers, but won’t replace good scouting or surveys.
References
- 1 = Herms, D.A. Using degree days and plant phenology to predict pest activity. Chapter 11, p. 49-59. Tactics and Tools for IPM. Ohio State University. Wooster, OH.
- 2 = Sadof, C.S. 1994. Recommendations for managing insects and mites on shade trees and shrubs. Purdue University, Dept. of Entomology publication E-41. West Lafayette, IN. 117 p.
- 3 = MSU field observations.
- 4 = Fondren, K. and D.G. McCullough. 2002. Biology and management of balsam twig aphid. MSU Extension bulletin E-2813. 4 p.
- 5 = Fondren, K. and D.G. McCullough. 2002. Biology and management of pine needle scale. MSU Extension bulletin E-2812. 4 p.
- 6 = McCullough, D.G. and C.S. Sadof. 1998. Evaluation of an integrated management and compliance program for Tomicus piniperda (Coleoptera: Scolytidae) in pine Christmas tree fields. Journal of Economic Entomology 91:785-795.
- 7 = Eliason, E.A. and D.G. McCullough. 1997. Survival and fecundity of three insects reared on four varieties of Scotch pine Christmas trees. Journal of Economic Entomology 90:1598-1608.


 Print
Print Email
Email