Seed Selection Cost Comparison Decision Tool
DOWNLOADOctober 13, 2022 - Jonathan LaPorte, MSU Extension
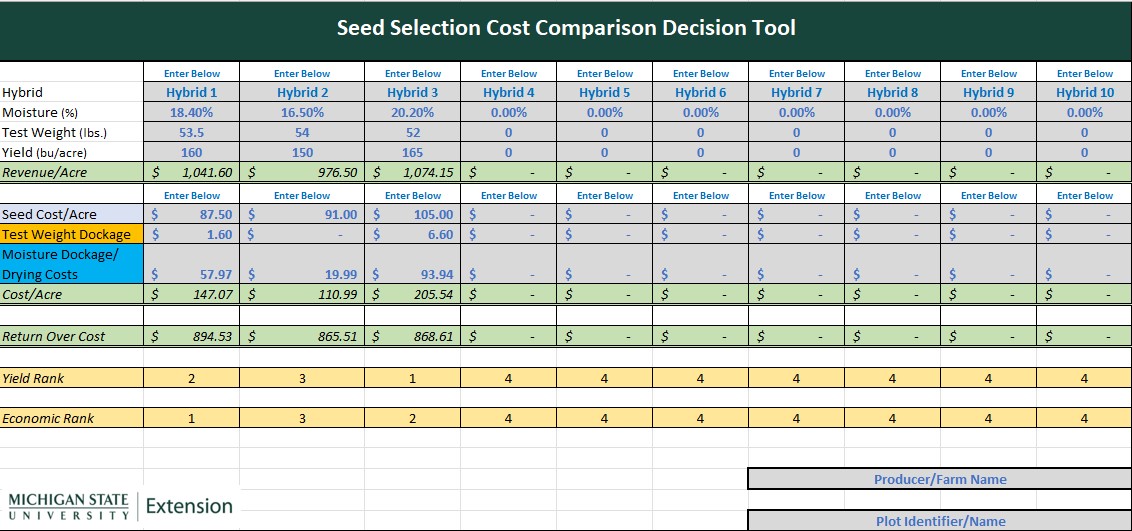
The Seed Selection Cost Comparison Decision Tool provides farm producers with an ability to consider yield and economic returns of selecting seed products. Utilizing test plot or in-field yield results, producers can determine which seed hybrids or varieties provide the best opportunity to maximize production and profitability.
The tool is designed to allow comparison of up to 20 different seed hybrids or varieties. It can also be used to compare multiple results of the same seed hybrid or variety from a number of different test plots. This feature allows maximum use for individual test plots or comparisons of a large set of seed selection data as you determine which options are best for your farm.
The decision tool starts by entering in basic information about the type of seed being compared. Hybrid or variety names, moisture content, test weight, and yield results. A revenue per acre is calculated using a market price entered in the Computation Center area of the tool. Below the revenue per acre area is a section for calculating a “cost per acre” for each seed hybrid/variety.

Once revenue and cost information are input for each seed hybrid or variety, a “return over cost” can be calculated. The decision tool then compares both yield and economic returns. A yield rank is calculated based on yield data, while an economic rank is calculated using return over cost data. These rankings help to illustrate the potential economic benefit of all seed options, not just focusing entirely on those with top yield results.
What you’ll need to use the tool:
- Hybrid/variety name
- Harvest moisture
- Test weight
- Yield Results
- Seed Costs (per bag) and Seeds Per Bag
- Planting Population
- Shrink Loss % (recommend using local grain elevator rates)
- Drying Cost (recommend using local grain elevator rates, if on-farm rates unknown)
- Test weight charge rates (recommend using local grain elevator rates)
Computation Center:
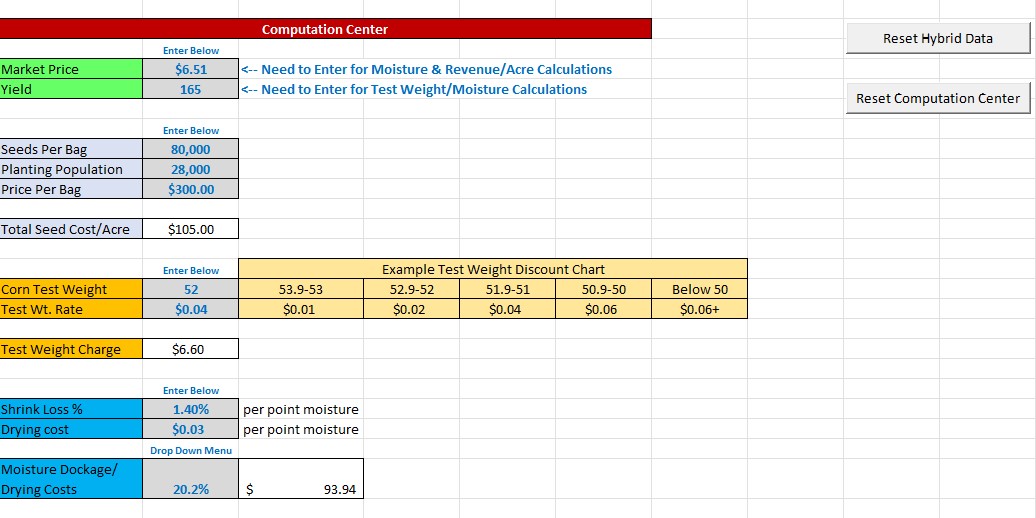
This area of the tool provides the details needed to outline the costs associated with each seed hybrid/variety. It is designed to calculate individual values for each seed hybrid/variety being used within the tool. Values calculated must be manually input to the cost per acre area above.

Seed Cost/Acre – Enter the seeds per bag, planting population, and price per bag for a particular hybrid/variety. A total seed cost per acre is calculated that can be manually input into the cost area.
Test Weight – Enter the test weight for the selected hybrid or variety. A test weight rate or charge must be entered to calculate a “test weight charge” for input into the cost area. An example discount chart with rates at each level of test weight is provided, but local grain elevator information is recommended for better accuracy.
Moisture Shrink/Drying Costs – Enter the anticipated shrink loss % and drying cost of reducing moisture to desired marketable moisture level. Enter the harvested moisture value of the seed hybrid or variety. A total moisture dockage and drying cost value is calculated for input into the cost area of the tool. Values and costs from local grain elevator are recommended for better accuracy in this section. Total cost calculation based on Drying Cost and Shrink Factor formula as outlined by Iowa State University.
Yield Calculator:
There are a number of different methods used to calculate yields. The decision tool provides a couple simple calculators to assist producers in determining yields of individual hybrids or varieties.
For corn, the yield component or slide run method is the first option provided. It uses harvestable ears and counts of both kernel rows and kernels per row to calculate an estimated yield result. This method is the most common used across the industry.
There is also a test plot calculator that uses representative sample information and plot area to determine an estimated yield. A calculator for corn and for soybeans have been created to assist in estimating yield data. Note: this same method of using samples and plot area is recommended for calibrating yield monitors.
*Note: The tool is a macro-based Excel file with examples provided. The example is strictly an illustration of the tool functions and not based on actual data. Click the "reset" buttons on each page or section to clear tool for your individual use.
**Note (Non-Macro Users): The tool has been updated to ensure it functions if you do not have macro or Visual Basic for Application (VBA) capability. This is often the case if using the program online versus on a computer desktop. "Reset" or "toggle" buttons will not work, but fields that would be changed by those macro features are unlocked and can be manually entered. Please remember to “download” the file to your computer as some functions will not work in the display view of your internet browser.
Additional Seed Selection Resources:
Bulletins
Bulletin E-3430: How to Read a Seed Guide (Corn Edition)
Bulletin E-3431: How to Read a Seed Guide (Soybean Edition)
Bulletin E-3505: How to Read a Seed Guide (Wheat Edition)
Factsheets
Seed Selection: Beyond Yield and Disease Resistance (Corn Edition)
Seed Selection: Beyond Yield and Disease Resistance (Soybean Edition)
Seed Selection: Beyond Yield and Disease Resistance (Wheat Edition)


 Print
Print Email
Email


